
What Is the Availability Losses Report?
The Availability Losses Report helps you understand why machines and production lines are not producing during planned production time.
Availability is one of the three components of OEE (Overall Equipment Effectiveness), alongside Performance and Quality.
Availability = Production Time ÷ Planned Production Time × 100
Availability losses occur when production is planned but equipment is stopped, for example because of breakdowns, material shortages, or changeovers.
The report helps you identify the largest causes of downtime and prioritize improvements that increase production availability.
Understanding the Report
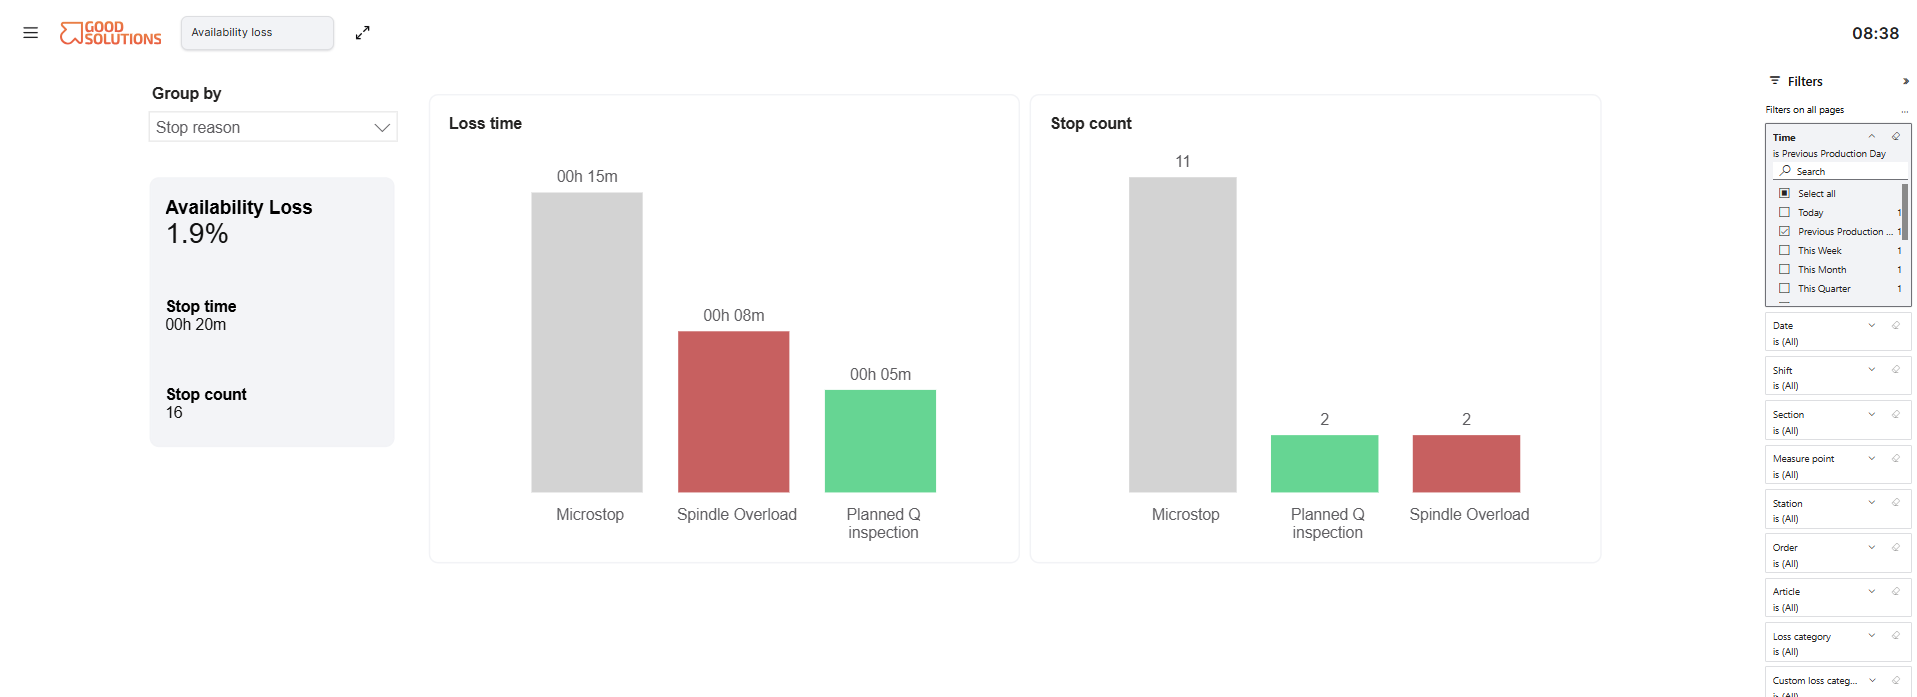
The Availability Losses Report allows you to analyse production stops and their impact on production time.
By selecting different time periods, applying filters, and changing how information is grouped, you can investigate losses from different perspectives.
For example, you can identify:
- Which stop reasons account for the most downtime.
- Which Measure Points experience specific problems.
- Whether similar problems occur across different Stations.
- Which stop categories contribute most to lost production time.
- Which problems should be prioritized for improvement.
Grouping Your Availability Losses
The Group by selector determines how downtime is organized in the report.
You can choose between six grouping options:
| Group by | What It Shows |
|---|---|
| Stop reason & Measure point | Downtime for each stop reason, broken down by Measure Point. |
| Stop reason | Total downtime for each stop reason across the selected production data. |
| Station | Downtime grouped by Station. |
| Stop reason & Station | Downtime for each stop reason, broken down by Station. |
| Category | Downtime grouped by standard stop categories. |
| Custom category | Downtime grouped by customer-defined stop categories. |
Stop Reason & Measure Point
This is the default grouping shown in the report.
It helps you understand which specific problems affect individual machines or production lines.
Example: Material shortages account for 20 hours of downtime across three Measure Points. By grouping by Stop reason & Measure point, you discover that 15 of those hours occurred on one production line.
This helps identify where improvement activities should be focused.
Stop Reason
Groups all downtime by individual stop reason, regardless of where it occurred.
Example: The report shows that machine breakdowns account for 40 hours, material shortages for 25 hours, and changeovers for 15 hours.
This provides a clear overview of the largest causes of downtime.
Station
Groups downtime by Station, helping you compare where production interruptions occur.
Example: One Station accounts for significantly more downtime than the others. Further investigation can help determine which problems contribute to the difference.
Stop Reason & Station
Combines stop reasons with Stations to show which problems occur at specific locations.
Example: A recurring equipment failure causes 12 hours of downtime at one Station but only two hours at another.
This may indicate differences in equipment condition, maintenance requirements, or operating methods.
Category
Groups stop reasons into broader categories, making it easier to understand the overall distribution of downtime.
Example: Instead of reviewing individual breakdown reasons, you can see the total downtime associated with categories such as equipment problems, material shortages, or organizational interruptions.
The categories shown depend on how stop reasons are configured.
Custom Category
Groups downtime using customer-defined categories.
This allows organizations to analyse losses according to their own classification structure.
Example: A factory may use custom categories to distinguish between technical, logistical, and organizational losses.
This can help different departments understand which problems they are responsible for investigating.
How to Use the Availability Losses Report
Step 1: Select Your Time Period
Choose the period you want to analyse.
For example, use the previous production day for daily follow-up or a longer period to identify recurring problems.
Step 2: Apply Relevant Filters
Use the available report filters to focus on the production data you want to investigate.
For example, select a specific Measure Point, Section, or Shift where those filters are available.
Step 3: Choose How to Group the Data
Select the grouping that best answers your question.
- Want to know which problems cause the most downtime? Select Stop reason.
- Want to know where specific problems occur? Select Stop reason & Measure point.
- Want to compare different Stations? Select Station.
- Want to understand broader types of losses? Select Category or Custom category.
Step 4: Identify the Largest Losses
Review the results and identify the stop reasons, Stations, or categories responsible for the greatest amount of downtime.
Focus on recurring or significant losses that can realistically be reduced.
Step 5: Investigate and Follow Up
Use the Timeline to investigate when stops occurred and understand the surrounding production activities.
Discuss the findings with Operators, Maintenance, Logistics, or other relevant teams.
After implementing improvements, review the report again to determine whether downtime has decreased.
Practical Examples
Example 1: Finding the Largest Downtime Cause
A Production Manager groups the report by Stop reason.
| Stop Reason | Downtime |
|---|---|
| Machine breakdown | 35 hours |
| Material shortage | 22 hours |
| Changeover | 18 hours |
| Waiting for Operator | 5 hours |
Machine breakdowns represent the largest loss.
The Production Manager changes the grouping to Stop reason & Measure point and discovers that most breakdown-related downtime occurs on one machine.
Maintenance can now investigate a specific production problem rather than a general factory-wide issue.
Example 2: Comparing Stations
A factory groups the report by Station and discovers that one Station accounts for 40% of recorded downtime.
By changing to Stop reason & Station, the team identifies that repeated material shortages explain most of the difference.
Production and Logistics can then investigate material replenishment routines.
Example 3: Prioritizing Improvements by Category
A Production Manager selects Category to understand the overall distribution of Availability losses.
The report reveals that equipment-related stops account for 55% of downtime, while material-related stops account for 30%.
The team decides to prioritize equipment reliability improvements.
After implementing corrective actions, the report is used to follow up on whether equipment-related downtime has decreased.
The figures in these examples are illustrative.
Tips for Getting More Value from the Report- Start broad, then investigate details: Begin with Category or Stop reason, then use combined groupings to identify where losses occur.
- Focus on total downtime: A few long stops can have as much impact as many short interruptions.
- Ensure correct stop coding: Uncategorized or incorrectly categorized stops can make analysis misleading.
- Compare similar production conditions: Scheduling, Article mix, and operating conditions may influence downtime.
- Follow up regularly: Use the report during daily meetings and improvement activities to monitor progress.
Key Takeaways
The Availability Losses Report helps you understand why planned production time is being lost.
Its six grouping options allow you to analyse downtime by stop reason, Measure Point, Station, Category, or Custom Category.
By combining these perspectives, you can move from identifying the largest losses to understanding exactly where they occur.
The goal is to identify the production interruptions that matter most, investigate their causes, and systematically reduce downtime.