Dashboards in Good Solutions allow you to bring together the production information that matters most to you. This guide explains how to create your first Dashboard and start adding Visualisations.
Create a new Dashboard
To create a Dashboard:
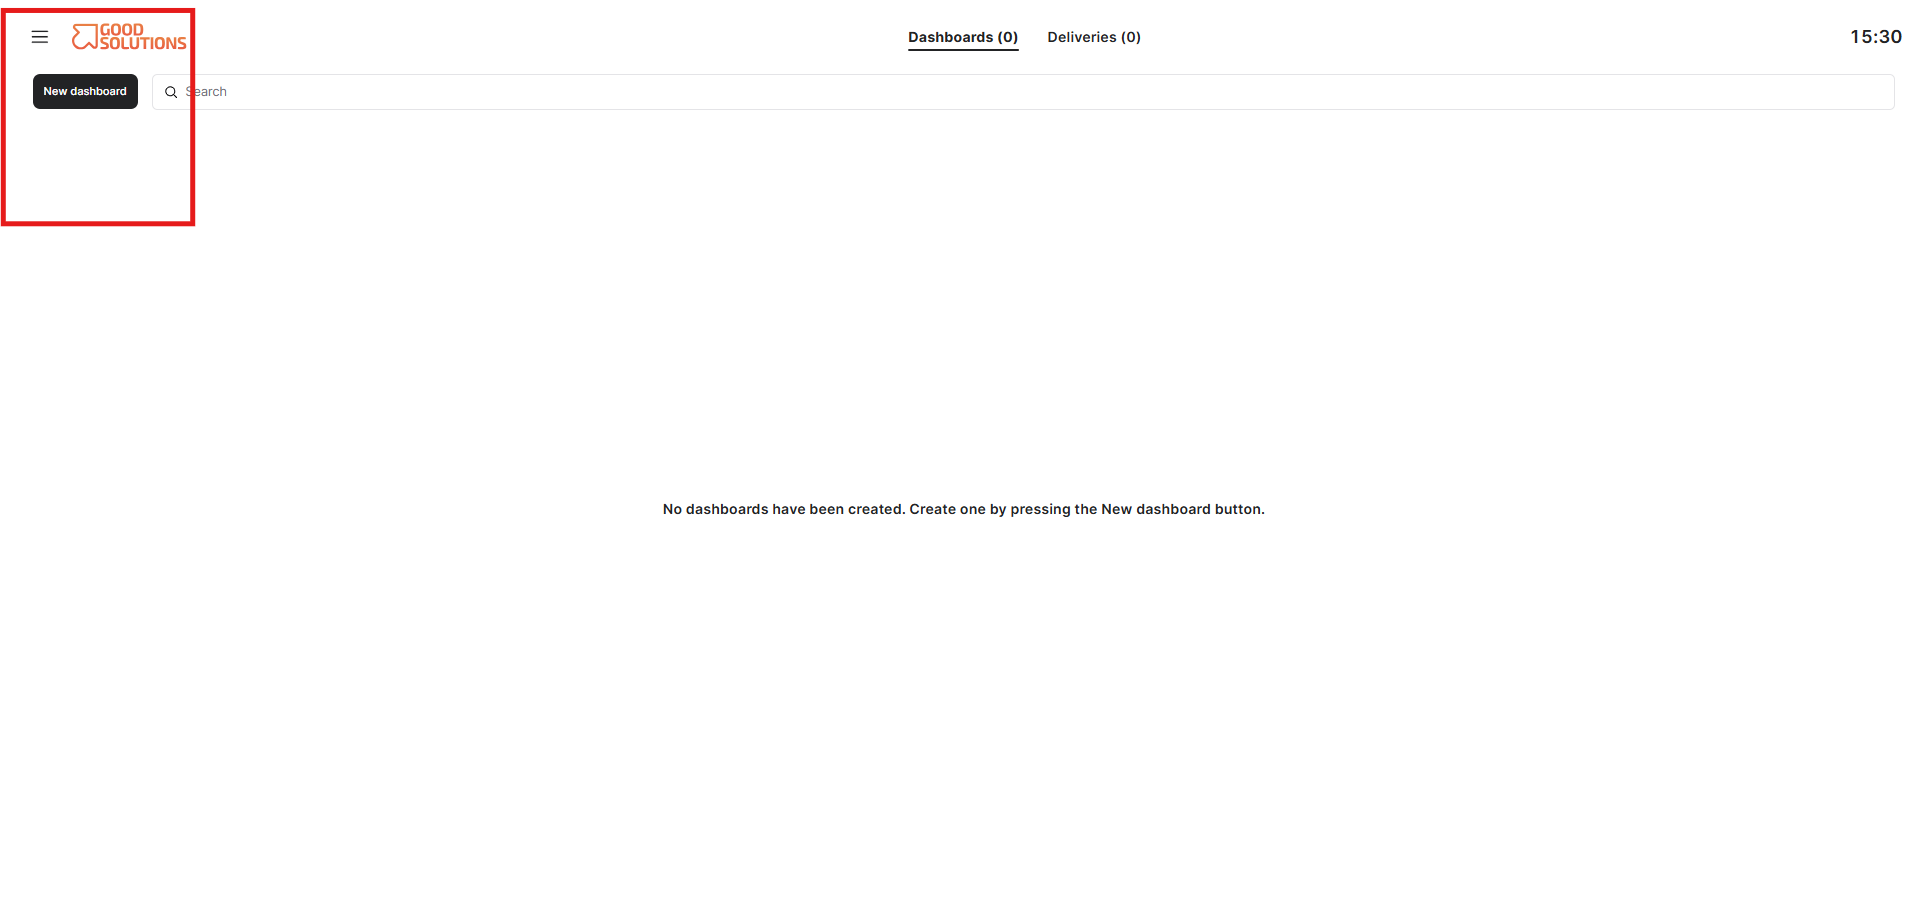
- Open Dashboards in the Good Solutions web product.
- Select Create Dashboard.
- Enter a name for your Dashboard.
- Add a description or other available settings if needed.
- Confirm to create the Dashboard.
Your new Dashboard is created and ready to be configured.
Add your first Visualisation
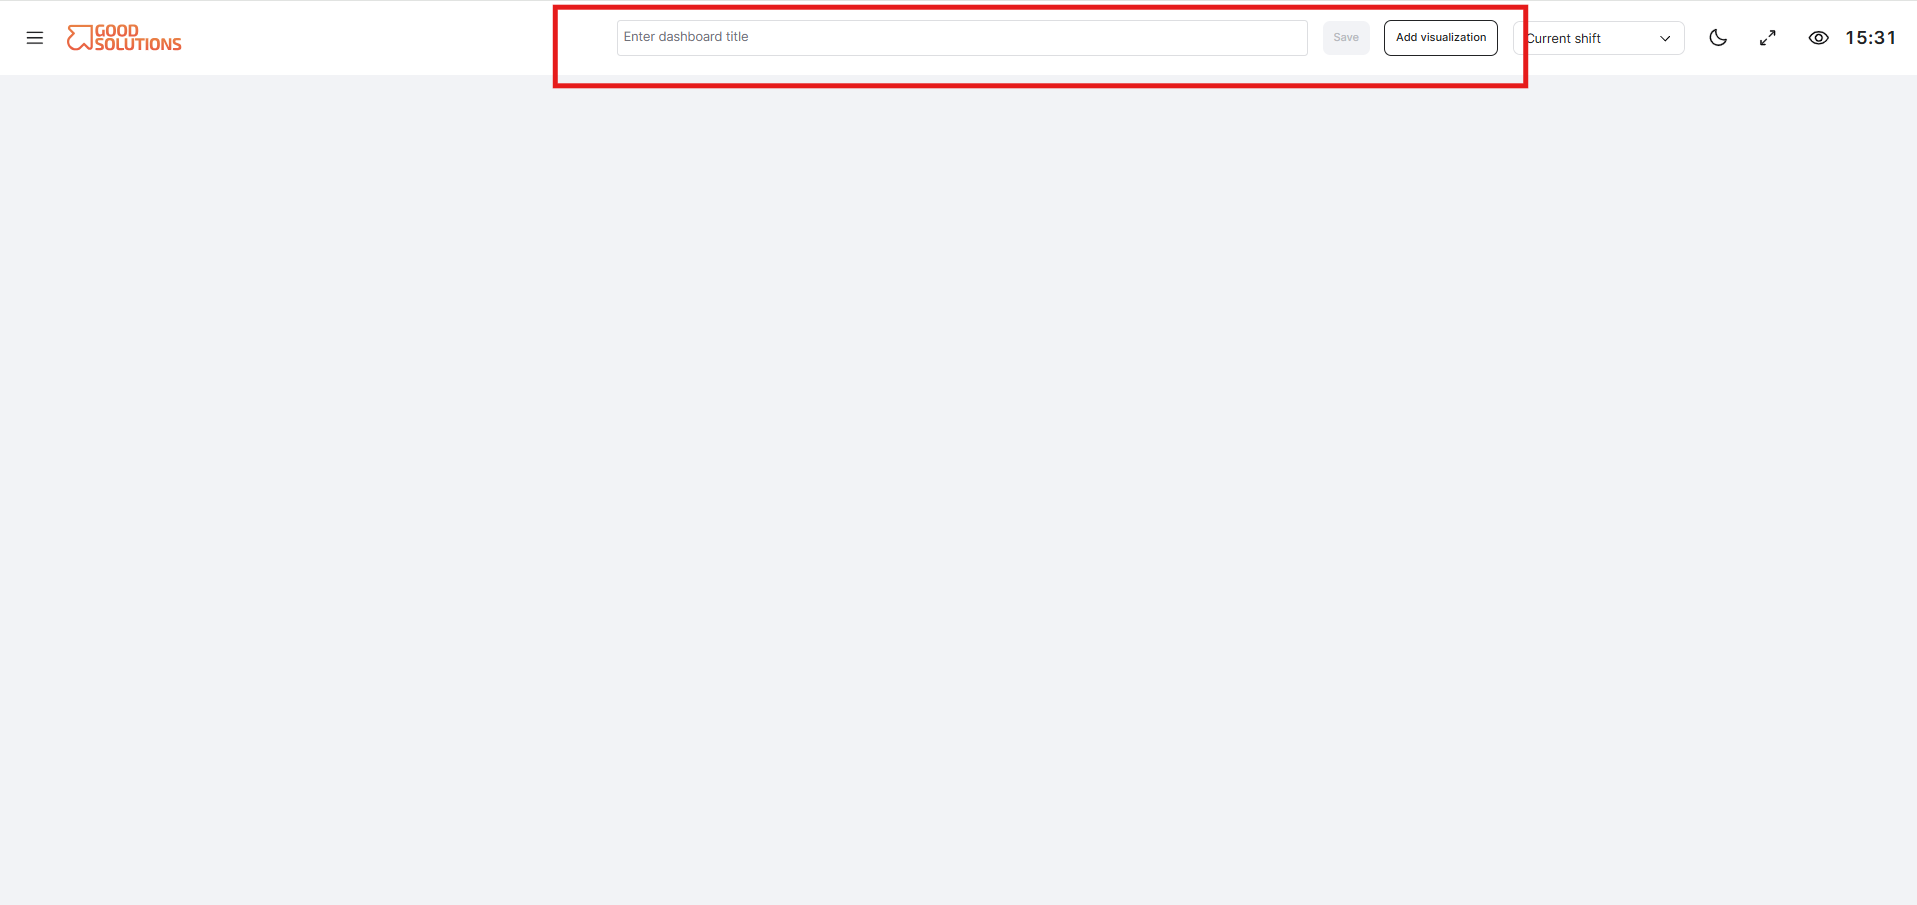
A new Dashboard starts as an empty workspace. To display production information, add one or more Visualisations.
- Make sure your new Dashboard is in Edit mode.
- Select Add Visualisation.
- Choose the type of Visualisation you want to add.
- Configure the Visualisation and select the production data you want it to display.
- Save your changes.
The Visualisation is now displayed on your Dashboard.
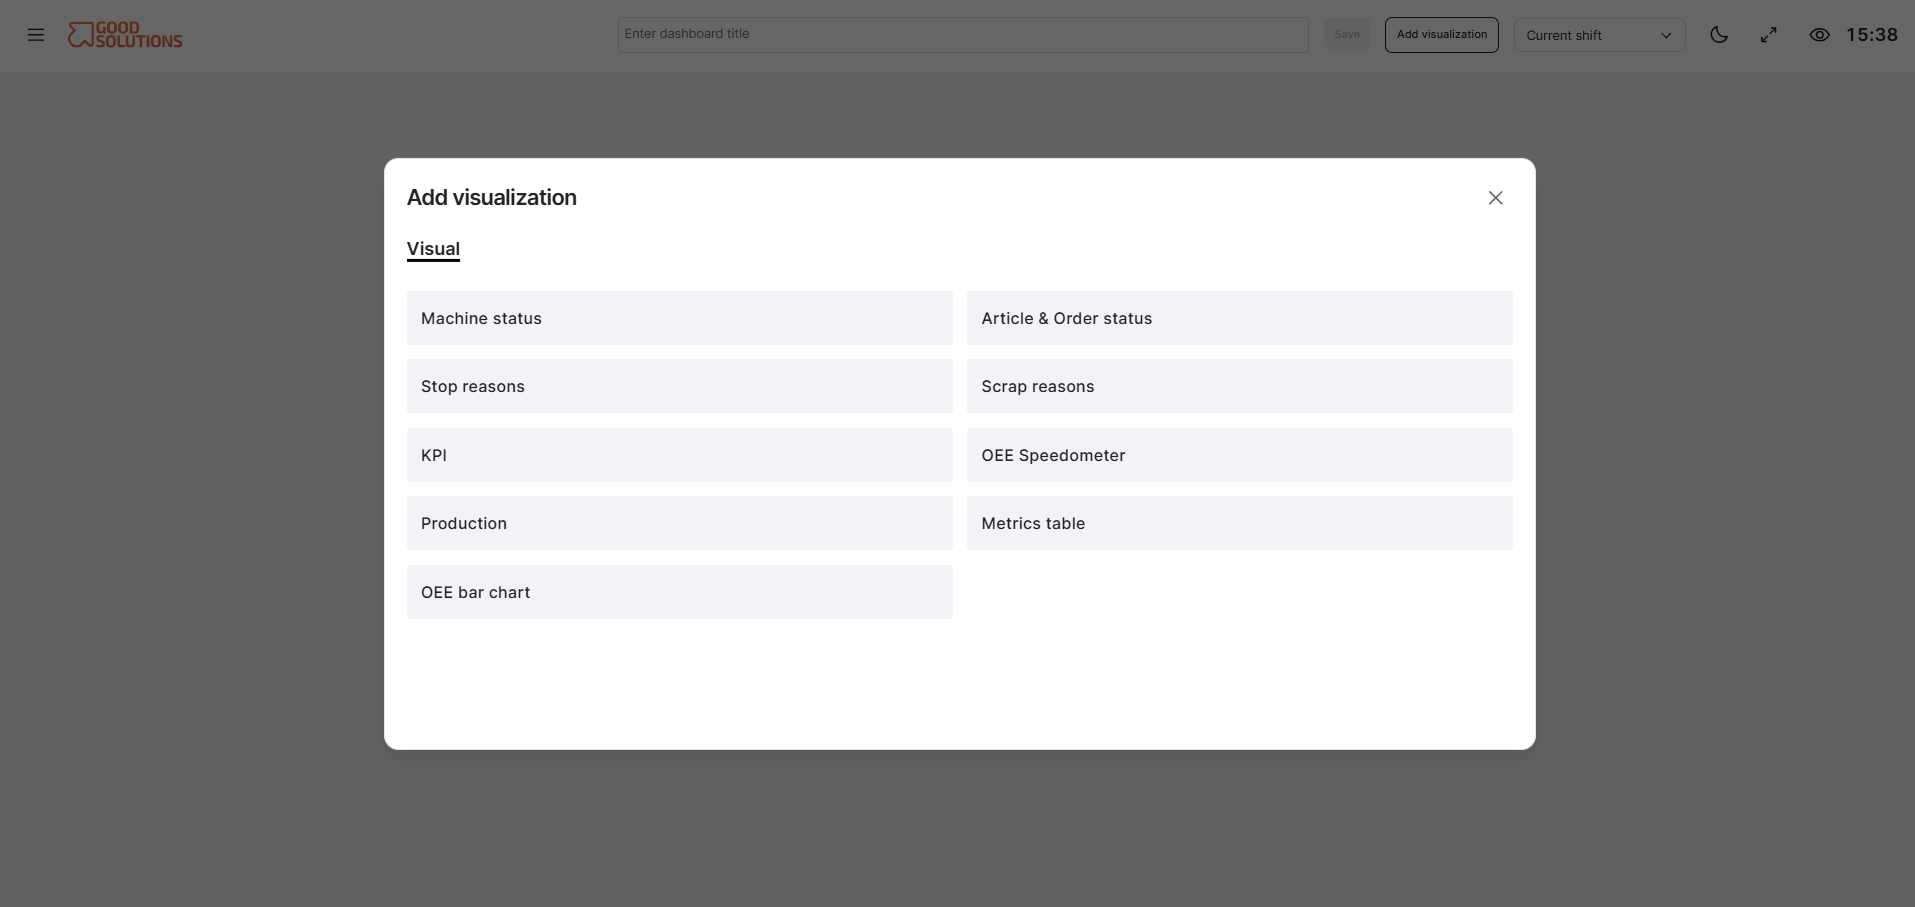
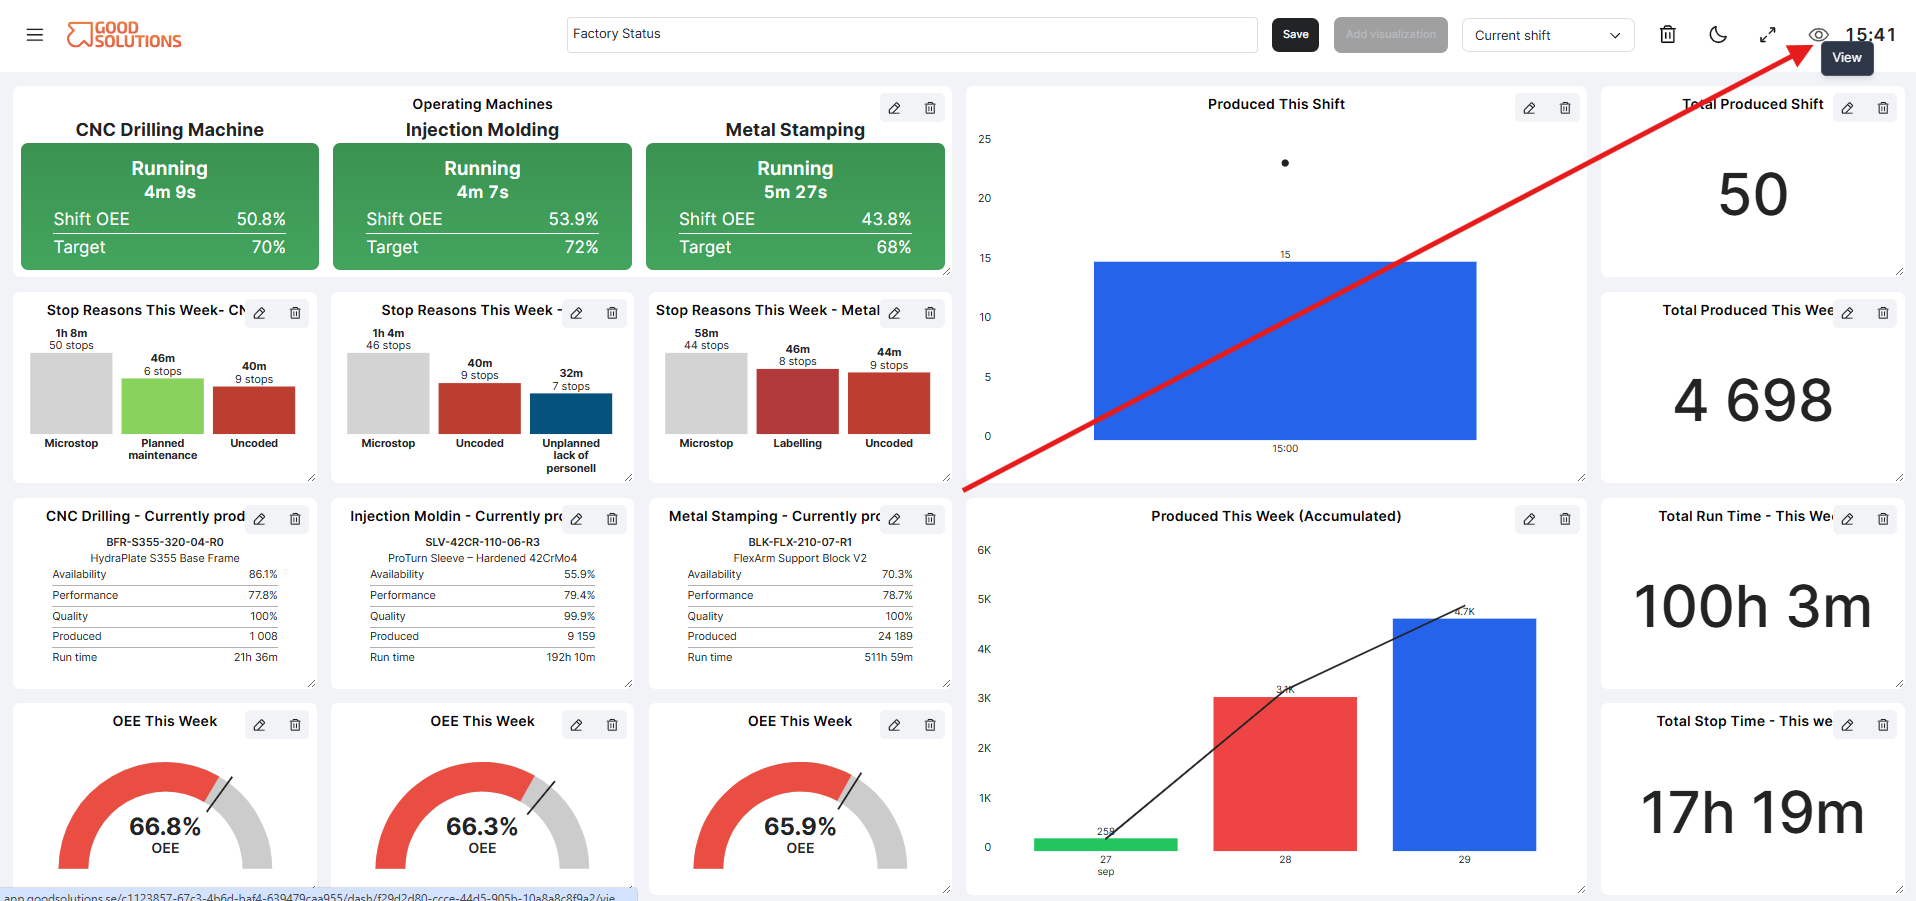
For your first Dashboard, you could start with a few important production metrics such as OEE bar chart, Production, Machine Status, and Stop Reasons.
Arrange your Dashboard
Once you have added Visualisations, arrange them to create a useful overview.
Depending on the Visualisation and Dashboard configuration, you can move and resize Visualisations to control how information is presented.
Consider placing the most important information at the top of the Dashboard, where it can be understood quickly.
Add more Visualisations
Continue adding Visualisations until your Dashboard contains the information you need.
Different Visualisations can answer different questions. For example:
- OEE – How effectively are we producing?
- Production – How much have we produced?
- Machine Status – What is happening in production right now?
- Stop Reasons – Where are we losing production time?
- Scrap Reasons – Why are we experiencing quality losses?
- Metrics Table – What are the key production figures?
You don't need to include everything. A focused Dashboard with a small number of relevant Visualisations is often easier to use than one containing too much information.
View your Dashboard
When you have finished configuring your Dashboard, switch from Edit mode to View mode.
View mode is designed for using the Dashboard to monitor and analyse production rather than changing its configuration.
Depending on your Dashboard setup, you can also use available time filters to change the period being displayed.
Continue improving your Dashboard
Your first Dashboard does not need to be perfect. You can return to Edit mode later to add, remove, resize, or reconfigure Visualisations as your needs change.
Consider what the Dashboard will be used for and who will use it. A Dashboard for a production-floor screen may need a different layout from one used for daily production meetings or detailed analysis.