
More than a Production Timeline
The Timeline in Good Solutions is more than a historical record of machine activity. It is a powerful operational tool that helps production leaders understand what is happening on the shop floor and where attention is needed.
By visualizing production activities over time, the Timeline makes it easier to identify patterns, investigate problems, and make informed decisions based on actual production data.
The Timeline is particularly valuable for four key activities:
- Monitor ongoing production: Understand which machines are running, stopped, and what Articles or Orders are currently being produced.
- Analyse production visually: Identify recurring stops, unusual production patterns, and opportunities to improve performance.
- Identify and correct bad data: Find uncategorized stops, incorrect stop reasons, and other data quality issues.
- Support daily production management: Use production history to discuss problems, prioritize improvements, and follow up on actions.
1. Monitor Ongoing Production
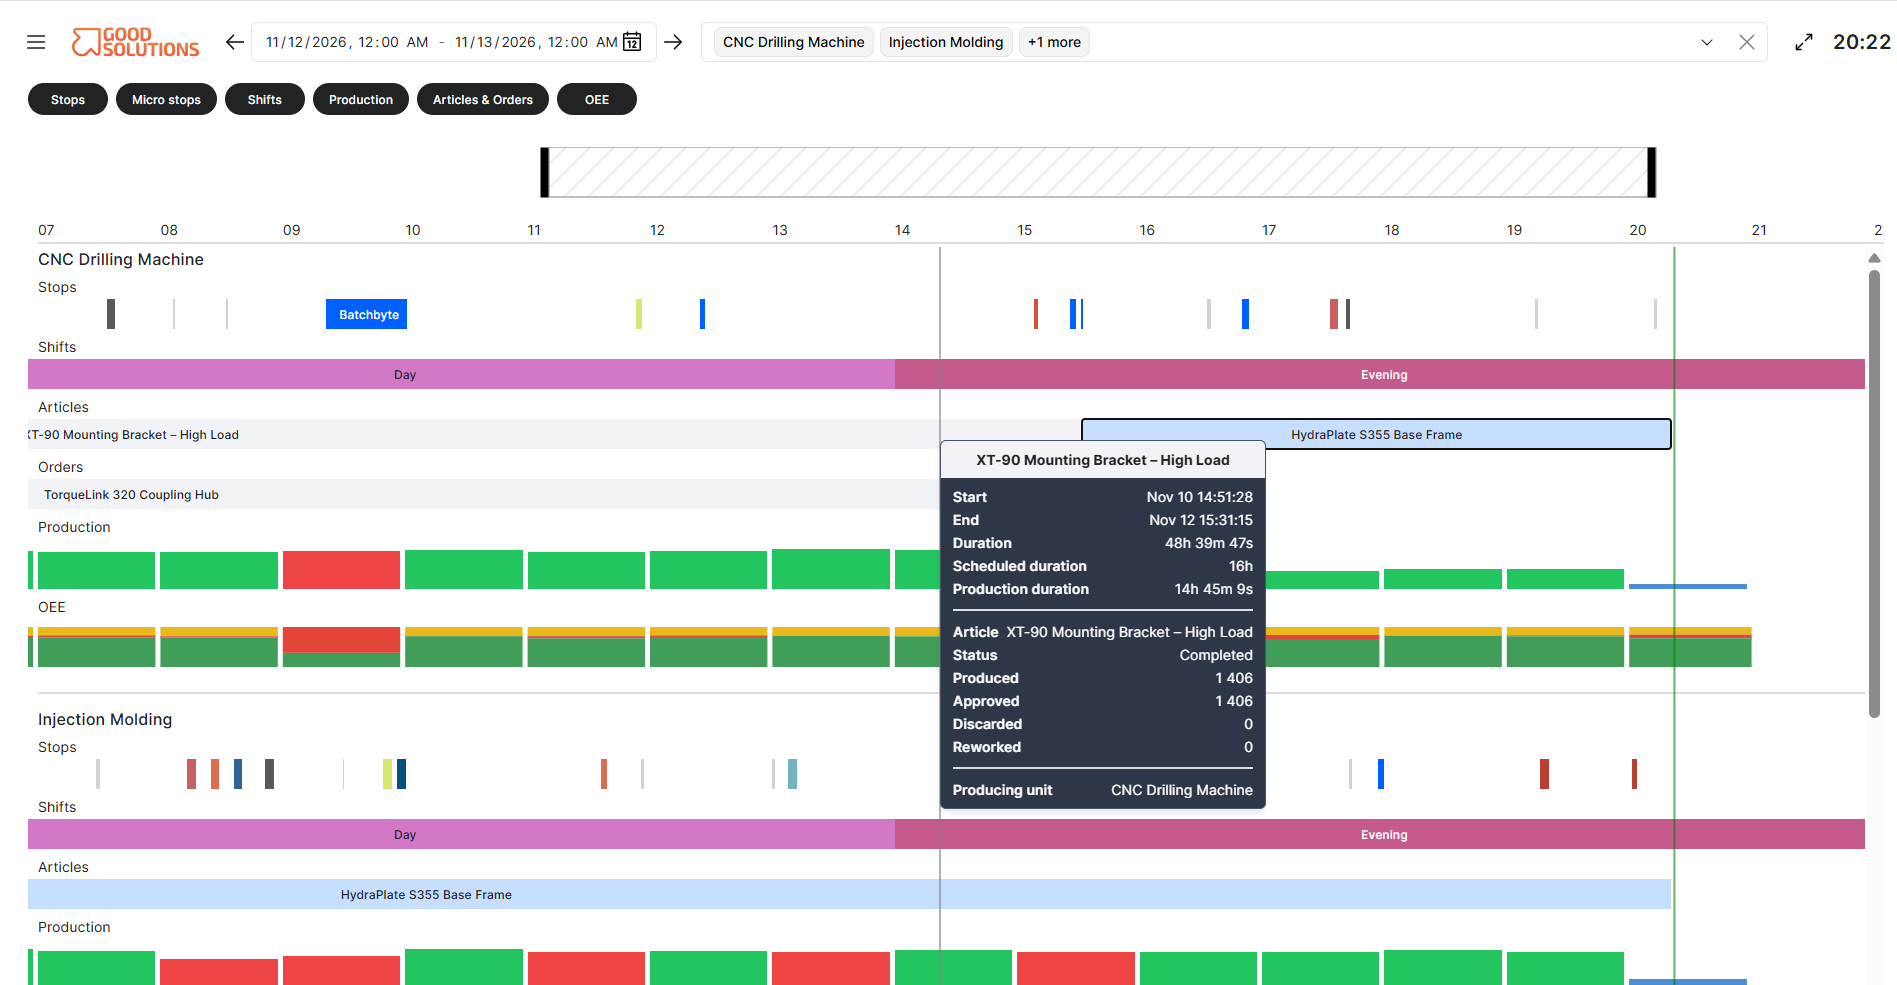
The Timeline provides an overview of production activities across your selected Measure Points.
By selecting the current production day and relevant Measure Points, you can quickly see what is happening across your production environment.
For example, you can use the Timeline to:
- See which machines are currently running or stopped.
- Identify which Articles are being manufactured.
- Review which production Orders are currently active.
- Understand how long machines have been running or stopped.
- Identify production interruptions that may require attention.
Example: Monitoring production during a shift
Imagine you are responsible for five production lines.
By opening the Timeline and selecting all five Measure Points, you can get a visual overview of their production activities.
You notice that one machine has been stopped for an extended period while the others are running.
Instead of waiting for the next production meeting, you can investigate the interruption and determine whether action is needed.
The value: Gain better visibility into ongoing production and identify issues that may require immediate attention.
2. Analyse Production Visually
Production data is often easier to understand when it is presented visually.
The Timeline makes it possible to see how production activities develop over time rather than relying exclusively on numbers and summary reports.
By reviewing the Timeline, you can identify:
- Frequent short stops that interrupt production.
- Long periods of downtime.
- Recurring interruptions at certain times of the day.
- Differences in production patterns between shifts.
- Production interruptions associated with particular Articles or Orders.
Example: Identifying recurring short stops
A machine has an OEE of 65%, but the reason for the low performance is not immediately obvious.
When you open the Timeline, you notice that the machine experiences many short stops throughout the shift.
Although each stop is relatively short, together they account for a significant amount of lost production time.
You can zoom in, review the stops, and investigate whether they share a common cause.
The value: Quickly identify patterns that may be difficult to recognize in traditional reports and use them to guide improvement activities.
3. Identify and Correct Bad Production Data
Reliable production data is essential for making good decisions.
However, production data is not always complete or correctly categorized. Operators may forget to assign stop reasons, or a longer stop may contain several different causes.
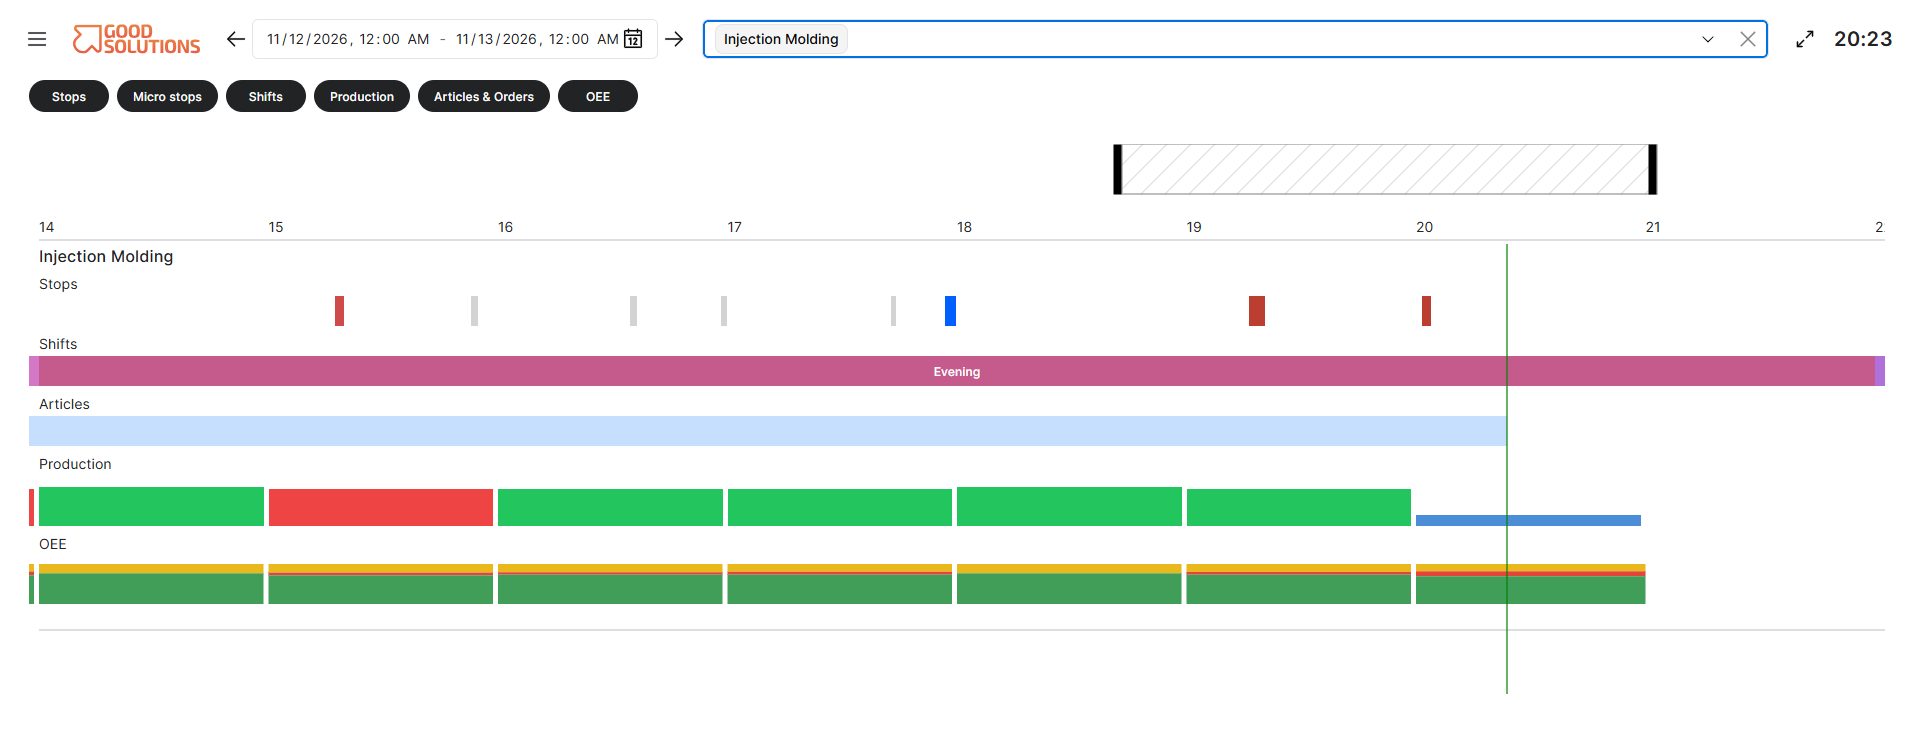
The Timeline helps you visually identify these situations.
For example, you can look for:
- Uncategorized stops: Production interruptions that have not been assigned a stop reason.
- Incorrect stop reasons: Stops that appear to have been categorized incorrectly.
- Long stops requiring investigation: Interruptions that may contain multiple underlying causes.
- Unexpected production patterns: Periods that appear inconsistent with what actually happened in production.
Example: Improving stop data quality
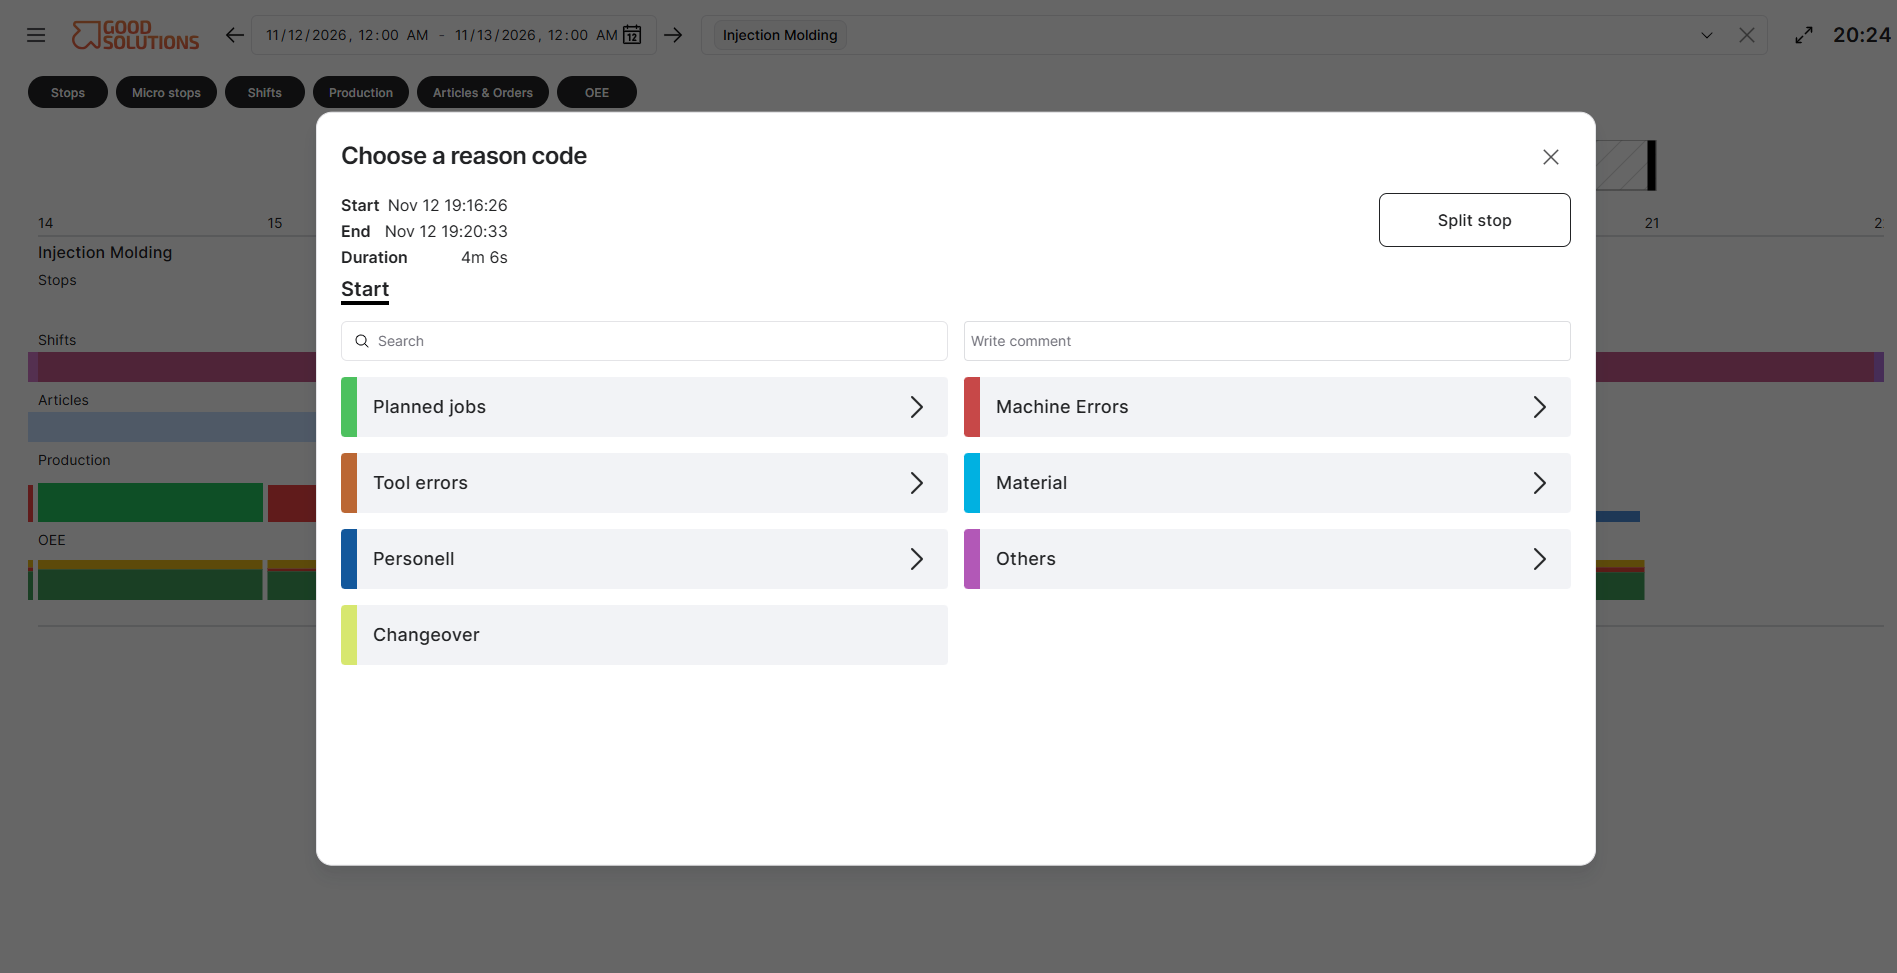
During your daily production review, you notice a two-hour uncategorized stop in the Timeline.
After speaking with the production team, you discover that the machine was stopped for 30 minutes due to a mechanical issue and then remained stopped for 90 minutes because materials were unavailable.
By splitting the stop and assigning the correct stop reasons, you improve the accuracy of your production data.
This ensures that future reports correctly distinguish between technical problems and material-related losses.
The value: Improve data quality directly in the operational workflow, resulting in more reliable OEE calculations, loss analysis, and improvement priorities.
4. Support Daily Production Management
The Timeline can become a valuable part of daily production meetings and shift follow-ups.
Instead of discussing performance based only on summary numbers, production leaders can use the Timeline to show exactly when problems occurred and how production developed.
Example: Reviewing yesterday's production
A Production Manager opens the Timeline during the morning production meeting.
The team follows a simple process:
- Select the previous production day to review yesterday's activities.
- Select relevant Measure Points to focus on the production area.
- Display production stops, Articles, and Orders to provide context.
- Identify significant interruptions and unusual production patterns.
- Review uncategorized stops and correct missing or inaccurate information.
- Discuss the main losses and agree on improvement actions.
This creates a shared understanding of what happened and helps the team focus on the most important issues.
The value: Make daily production meetings more fact-based, visual, and action-oriented.
5. Understand Production in the Context of Articles and Orders
Production performance often depends on which products are being manufactured.
Different Articles may require different machine settings, production speeds, or changeover activities.
By displaying Article and Order information in the Timeline, you can understand which products were being manufactured when specific events occurred.
For example, you can:
- Identify which Article was running when a machine stopped.
- Review production activities associated with a particular Order.
- Investigate interruptions around Article or Order changes.
- Understand how production progressed during different production runs.
Example: Investigating changeover losses
A Production Manager notices that a machine frequently experiences long interruptions between production Orders.
By reviewing the Timeline with Article and Order information visible, it becomes easier to identify when these interruptions occur.
The team can then investigate whether changeover procedures, material preparation, or machine setup activities could be improved.
The value: Connect production performance to actual manufacturing activities and identify more specific opportunities for improvement.
Getting Started: A Simple Daily Routine
To make the Timeline part of your daily operational management, consider the following routine:
| Step | Activity | Purpose |
|---|---|---|
| 1 | Select the current or previous production day. | Focus on relevant production activities. |
| 2 | Select your Measure Points. | Review the machines or production lines you are responsible for. |
| 3 | Enable relevant information. | Display stops, Articles, Orders, and other useful data. |
| 4 | Review the Timeline visually. | Identify unusual patterns and significant interruptions. |
| 5 | Investigate and correct data. | Improve the accuracy of production information. |
| 6 | Identify improvement opportunities. | Decide which problems require attention or follow-up. |
Even a few minutes of regular Timeline review can help production leaders develop a better understanding of their operations.
Tips for Creating Value with the Timeline- Use it daily: Make the Timeline part of your regular production follow-up.
- Look for patterns, not just individual stops: Repeated small interruptions can have a major impact on production performance.
- Keep data accurate: Review uncategorized stops and correct errors when identified.
- Display Articles and Orders: Understand production events in their operational context.
- Compare Measure Points: Identify differences in production behaviour across machines.
- Use it during meetings: Visual production history helps teams discuss problems using the same information.
- Combine with Reports: Use the Timeline to understand when something happened and Reports to quantify its impact.