
What Are Dashboard Time Filters?
Time filters determine which period of production data is displayed in your Dashboard.
Good Solutions uses two levels of time filtering:
- Dashboard Time Filter: Sets the default time period for all visualisations in the Dashboard.
- Visualisation Time Filter: Allows an individual visualisation to use a different time period, overriding the Dashboard Time Filter.
This makes it possible to combine different time perspectives within the same Dashboard.
1. Dashboard Time Filter
The Dashboard Time Filter controls the time period used by the Dashboard as a whole.
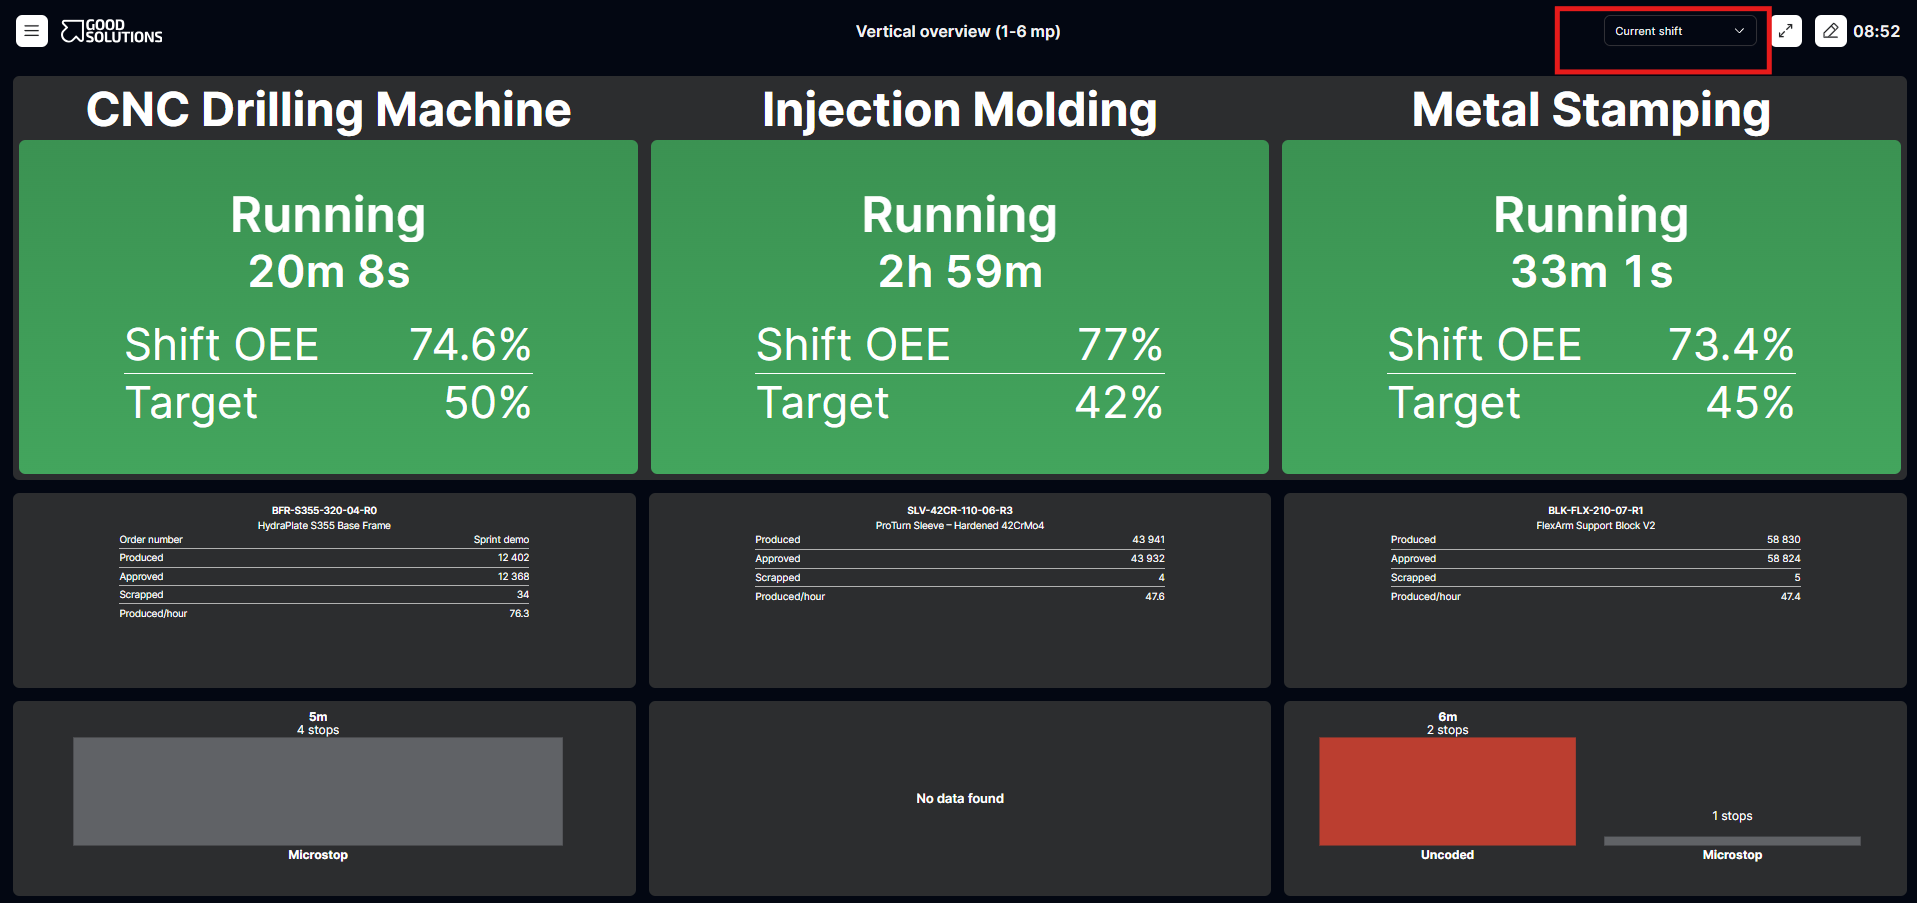
For example, if you select Current Shift, all visualisations that use the Dashboard Time Filter will display production data for the current shift.
You can use the Dashboard Time Filter to:
- Monitor production during the current shift.
- Review performance from the previous production day.
- Analyse production results over the last seven days.
- Follow longer-term production trends.
Important: Changing the Dashboard Time Filter updates all visualisations that inherit its time period. Visualisations with their own time filter are not affected.
2. Visualisation Time Filter
Each visualisation can have its own time filter.
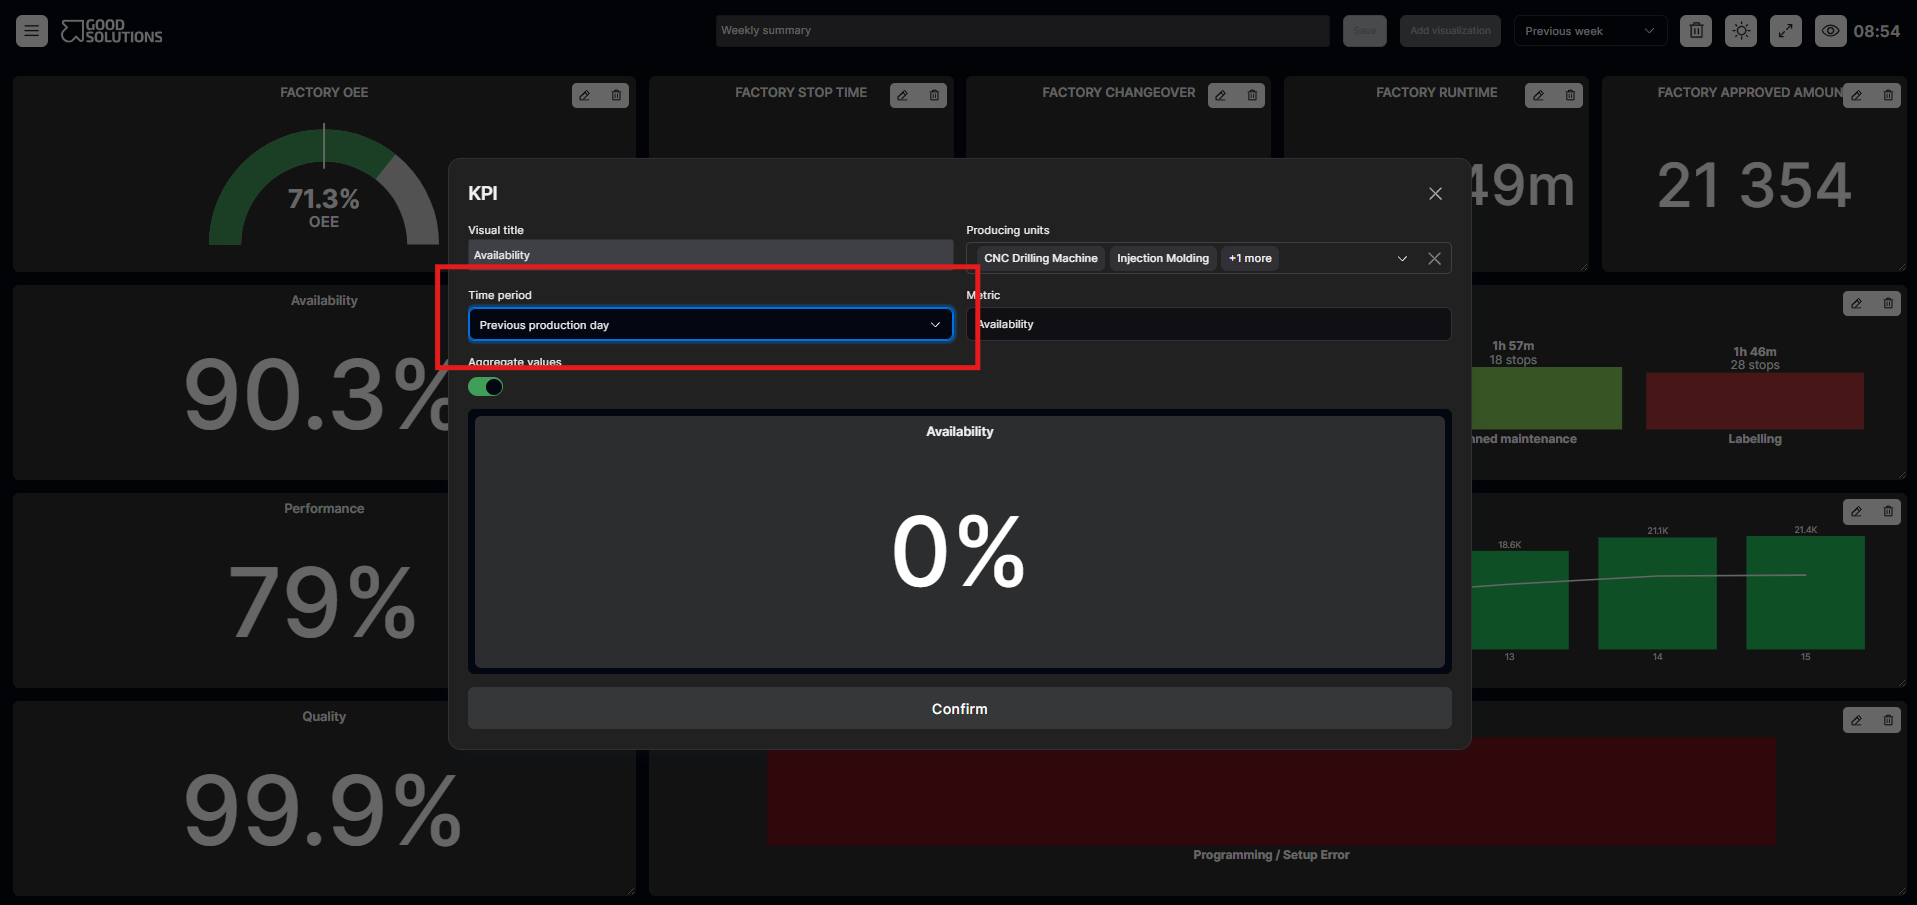
This allows you to display information for a different period than the one selected for the Dashboard.
For example, you might want a Dashboard showing current shift performance while also displaying a chart of OEE performance over the last 30 days.
By setting the OEE chart's time filter to Last 30 Days, it will continue to display that period even when the Dashboard Time Filter changes.
Important: An individual visualisation's time filter takes priority over the Dashboard Time Filter.
Example: Combining Different Time Periods
Imagine a Production Dashboard configured as follows:
Dashboard Time Filter: Current Shift
| Visualisation | Time Filter | Data Displayed |
|---|---|---|
| OEE KPI | Dashboard default | Current Shift |
| Production Output | Dashboard default | Current Shift |
| Machine Status | Dashboard default | Current Shift |
| OEE Trend | Last 30 Days | Last 30 Days |
| Scrap Overview | Current Week | Current Week |
In this example, the first three visualisations follow the Dashboard Time Filter.
The OEE Trend and Scrap Overview have individual time filters and therefore display different periods.
If you change the Dashboard Time Filter to Previous Shift, only the first three visualisations change.
The OEE Trend continues to show the last 30 days, and the Scrap Overview continues to show the current week.
How to Configure Time Filters
Set the Dashboard Time Filter
- Open the Dashboard.
- Locate the Dashboard's time filter.
- Select the time period you want to analyse.
- Visualisations using the Dashboard Time Filter will display data for the selected period.
Override the Time Filter for a Visualisation
- Open the Dashboard in Edit mode.
- Select the visualisation you want to configure.
- Locate its time filter settings.
- Select the time period you want the visualisation to use.
- Save your changes.
The visualisation will now use its own time period instead of the Dashboard's default.
To make the visualisation follow the Dashboard Time Filter again, select the option to use the Dashboard's time period in the visualisation settings.
When Should You Use Individual Time Filters?
Individual time filters are particularly useful when combining operational monitoring with historical analysis.
Example 1: Daily Production Management
Display current shift KPIs alongside a seven-day OEE trend to understand whether today's performance is better or worse than recent results.
Example 2: Quality Monitoring
Display current production output alongside scrap data for the current month to identify recurring quality problems.
Example 3: Management Dashboards
Combine yesterday's production results with weekly and monthly performance trends to provide both short-term and long-term perspectives.
Tips for Using Dashboard Time Filters- Use the Dashboard Time Filter as your default: Keep most visualisations on the same time period for consistency.
- Override only when necessary: Use individual time filters when a different time perspective adds value.
- Make time periods clear: Ensure users understand which period each visualisation represents.
- Avoid misleading comparisons: Remember that visualisations showing different time periods may not be directly comparable.
Key Takeaways
Good Solutions Dashboards use a simple hierarchy for time filtering:
Dashboard Time Filter → Default for all visualisations
Visualisation Time Filter → Overrides the Dashboard Time Filter for that visualisation
This flexibility allows you to create Dashboards that combine current production performance with historical trends, without needing separate Dashboards for each time period.