
What Is the Article & Order Status Visualisation?
The Article & Order Status visualisation provides an overview of the Article or Order currently being produced at a selected production unit.
It allows Operators, Production Leaders, and Production Managers to monitor production performance without navigating to separate reports.
You can customize the visualisation by selecting which production metrics to display.
Understanding the Visualisation
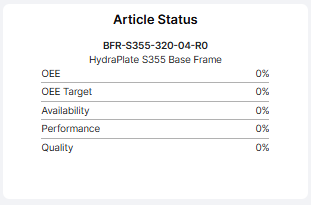
The visualisation displays information about the selected Article or Order, together with its production metrics.
For example, an Article Status visualisation may show:
- Article Number: The identifier of the Article being produced.
- Article Name: The name or description of the Article.
- OEE: Overall Equipment Effectiveness.
- OEE Target: The expected OEE performance.
- Availability: The percentage of planned production time spent producing.
- Performance: Production efficiency compared with the expected speed.
- Quality: The percentage of production meeting quality requirements.
The displayed metrics depend on how the visualisation has been configured.
Available Metrics
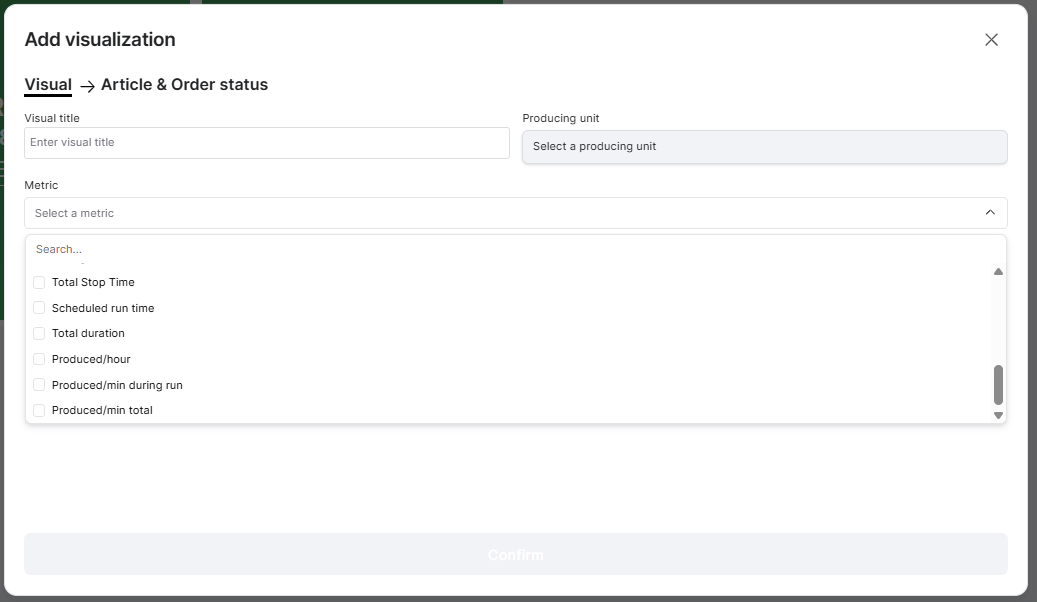
When configuring the visualisation, you can select which metrics should be displayed.
The available metrics shown in the configuration include:
| Metric | Description |
|---|---|
| OEE | Overall Equipment Effectiveness. |
| OEE Target | Target OEE for the production unit. |
| Availability | Percentage of planned production time spent producing. |
| Performance | Production speed efficiency compared with the expected speed. |
| Quality | Percentage of production meeting quality requirements. |
| Produced | Total number of units produced. |
| Approved | Number of approved units. |
| Scrapped | Number of units recorded as scrap. |
| Reworked | Number of units recorded for rework. |
| Run time | Time spent running production. |
| Changeover Time | Time spent on changeovers. |
| Total Stop Time | Total recorded stop time. |
| Scheduled run time | Scheduled time allocated to production. |
| Total duration | Total duration of the production activity. |
| Produced/hour | Production rate expressed as units per hour. |
| Produced/min during run | Production rate per minute during actual running time. |
| Produced/min total | Production rate per minute across the total duration. |
You can select multiple metrics to create a visualisation suited to your production environment.
How to Add the Article & Order Status Visualisation
- Open the Dashboard you want to configure.
- Enter Edit mode.
- Select Add visualisation.
- Choose Article & Order Status.
- Enter a Visual title, such as Current Article or Order Status.
- Under Producing unit, select the production unit you want to monitor.
- Under Metric, select the metrics you want to display.
- Click Confirm to add the visualisation to your Dashboard.
The visualisation will display the selected production information for the configured production unit.
Practical Examples
Example 1: Monitor Current Article Performance
Configure the visualisation with:
- OEE
- OEE Target
- Availability
- Performance
- Quality
This gives Operators and Production Leaders a quick overview of how efficiently the current Article is being produced.
Example 2: Follow Production Quantities
Select:
- Produced
- Approved
- Scrapped
- Reworked
This provides an overview of production quantities and quality results for the selected Article or Order.
It can be useful during production follow-up and shift handovers.
Example 3: Monitor Production Speed
Select:
- Produced/hour
- Produced/min during run
- Produced/min total
These metrics help Production Managers understand production rates and investigate differences between actual output and expected performance.
Example 4: Understand Production Time
Select:
- Run time
- Changeover Time
- Total Stop Time
- Scheduled run time
This provides an overview of how production time is distributed and helps identify opportunities to reduce interruptions.
Tips for Getting More Value
- Select only relevant metrics: Avoid displaying too much information in a single visualisation.
- Adapt the content to the audience: Operators may benefit from production quantities, while Production Managers may focus on OEE and time losses.
- Combine with Machine Status: Show current machine status alongside Article or Order performance.
- Use consistent metrics: Display similar metrics across production units to make comparisons easier.
- Review production deviations: Use the Timeline or Reports when a metric indicates unexpected performance.
Key Takeaways
The Article & Order Status visualisation provides a configurable overview of the Article or Order being produced at a selected production unit.
By choosing relevant metrics, you can monitor production efficiency, quantities, quality, and production time directly from your Dashboard.
Its main purpose is to make current Article and Order information easily accessible, helping production teams follow performance and identify deviations.