
What Is the KPI Metric Visualisation?
The KPI Metric visualisation displays a selected production metric as a large, easy-to-read value.
It provides Operators, Production Leaders, and Production Managers with a quick overview of production performance without needing to open detailed reports.
You can display metrics such as OEE, Availability, Performance, Quality, production quantities, and production time.
The visualisation can show results for multiple production units, making it easy to compare performance across machines or production lines.
Understanding the Visualisation
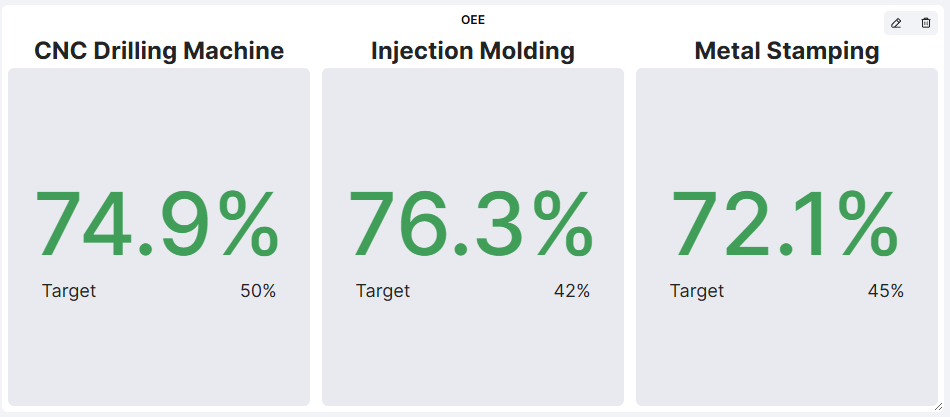
Each production unit is displayed in a separate panel containing:
- Production Unit: The name of the machine or production line.
- KPI Value: The value of the selected metric, displayed prominently.
- Target: The target value, where applicable.
- Color Indicator: A visual indication of performance relative to the target, where supported.
Example: OEE Performance
An OEE visualisation displays the following results:
| Production Unit | OEE | Target |
|---|---|---|
| CNC Drilling Machine | 74.9% | 50% |
| Injection Molding | 76.3% | 42% |
| Metal Stamping | 72.1% | 45% |
In this example, all three production units are performing above their OEE targets.
The large values and color indicators make it easy to understand performance at a glance.
How to Add the KPI Metric Visualisation
- Open the Dashboard you want to configure.
- Enter Edit mode.
- Select Add visualisation.
- Choose KPI.
- Configure the settings described below.
- Click Confirm to add the visualisation to your Dashboard.
Configuring the Visualisation
| Setting | Description |
|---|---|
| Visual title | Enter a descriptive name, such as OEE, Production Output, or Scrap. |
| Producing units | Select one or several production units to include. |
| Time period | Choose the time period used to calculate the metric. |
| Metric | Select which production metric to display. |
| Aggregate values | Choose whether to combine results from the selected production units into an aggregated value. |
Available Metrics
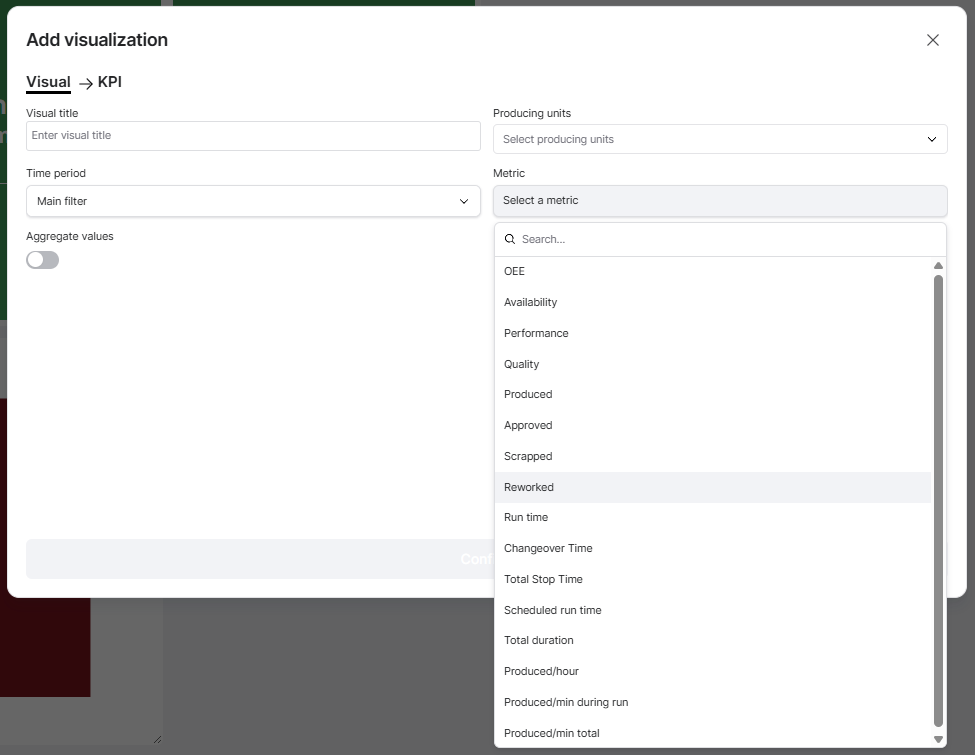
The KPI Metric visualisation supports a range of production metrics.
| Category | Available Metrics |
|---|---|
| Production Efficiency | OEE, Availability, Performance, Quality |
| Production Quantities | Produced, Approved, Scrapped, Reworked |
| Production Time | Run time, Changeover Time, Total Stop Time, Scheduled run time, Total duration |
| Production Speed | Produced/hour, Produced/min during run, Produced/min total |
The displayed value and unit depend on the selected metric.
Time Period
The visualisation can use the Dashboard's Main filter or an individual time period.
For example, your Dashboard might display current shift performance while a KPI visualisation shows OEE for the last seven days.
When an individual time period is selected, it overrides the Dashboard Time Filter for that visualisation.
Aggregate Values
The Aggregate values setting determines how results from multiple production units are presented.
- Disabled: Each selected production unit is displayed separately.
- Enabled: Results are combined into one aggregated KPI value.
For example, you could display OEE individually for three machines or show a combined OEE for the selected production units.
Note: Aggregated values use the applicable Good Solutions calculation logic. Percentage-based metrics such as OEE should not be interpreted as simple arithmetic averages.
Practical Examples
Example 1: Monitor OEE Against Targets
Select:
- Metric: OEE
- Producing units: Three production lines
- Time period: Current Shift
- Aggregate values: Disabled
The Dashboard displays each production line's OEE alongside its target, making it easy to identify which lines are performing below expectations.
Example 2: Display Total Production Output
Select:
- Metric: Produced
- Producing units: All relevant production units
- Time period: Current Shift
- Aggregate values: Enabled
This provides a combined production quantity for the selected production units.
Example 3: Monitor Quality Performance
Select Quality as the metric to display the percentage of production meeting quality requirements.
Alternatively, select Scrapped to monitor the number of scrapped units.
These metrics help production teams follow quality performance during daily meetings.
Example 4: Compare Production Speed
Select Produced/hour to compare production rates across selected production units.
This can help identify differences in production output, although comparisons should account for different Articles, cycle times, and production conditions.
Tips for Getting More Value
- Choose metrics relevant to your audience: Operators may focus on production quantities, while Production Managers may prioritize OEE and losses.
- Use targets where available: Targets help users quickly understand whether performance meets expectations.
- Combine related KPIs: Display OEE alongside Availability, Performance, and Quality to better understand production efficiency.
- Use aggregation appropriately: Aggregated values are useful for an overview, while individual values help identify differences between machines.
- Select meaningful time periods: Current Shift is useful for operational monitoring, while longer periods help evaluate trends.
- Keep Dashboards simple: Focus on the KPIs that support decisions and improvement activities.
Key Takeaways
The KPI Metric visualisation provides a clear and configurable way to monitor production performance.
You can select which metric to display, choose production units, configure the time period, and decide whether values should be displayed individually or aggregated.
Its main purpose is to make important production KPIs immediately visible, helping teams monitor results, compare performance, and identify deviations.