
What Is the Machine Status Visualisation?
The Machine Status visualisation provides a real-time overview of the current operating status of selected machines or production units.
Each machine is displayed as a separate, color-coded panel, making it easy to see which machines are running and which require attention.
The visualisation is particularly useful for Operators, Production Leaders, and Production Managers who need a quick overview of production status.
Understanding the Machine Status Visualisation
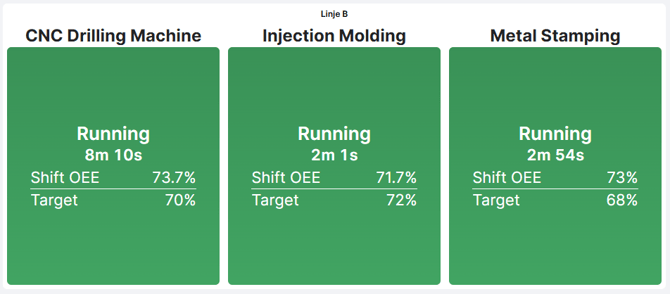
Each machine panel displays the following information:
| Information | Description |
|---|---|
| Machine Name | Identifies the machine or production unit. |
| Current Status | Shows whether the machine is running or stopped, including the stop status when applicable. |
| Status Duration | Shows how long the machine has been in its current state. |
| Shift OEE | Displays the machine's OEE for the current shift. |
| Target | Shows the OEE target for the machine. |
Status Colors
The background color helps users quickly distinguish between different machine states.
In the example:
- Green – Running: The machine is currently producing.
- Red – Stopped: The machine is stopped. The example displays Uncoded stop, indicating a stop that has not yet been assigned a stop reason.
The status text provides additional information about the machine's current state.
Example
A Dashboard displays three machines:
| Machine | Status | Shift OEE | Target |
|---|---|---|---|
| CNC Drilling Machine | Running | 74.8% | 50% |
| Injection Molding | Running | 76.5% | 42% |
| Metal Stamping | Uncoded stop | 73.2% | 45% |
The first two machines are running, while Metal Stamping is stopped.
Although Metal Stamping's Shift OEE is above its target, the current stop may still require attention.
Important: Machine Status shows the current operating condition, while Shift OEE reflects accumulated production performance during the shift. A machine can therefore be stopped while still having an OEE above target.
How to Add the Machine Status Visualisation
- Open the Dashboard you want to configure.
- Enter Edit mode.
- Select Add visualisation.
- Choose Machine Status from the available visualisations.
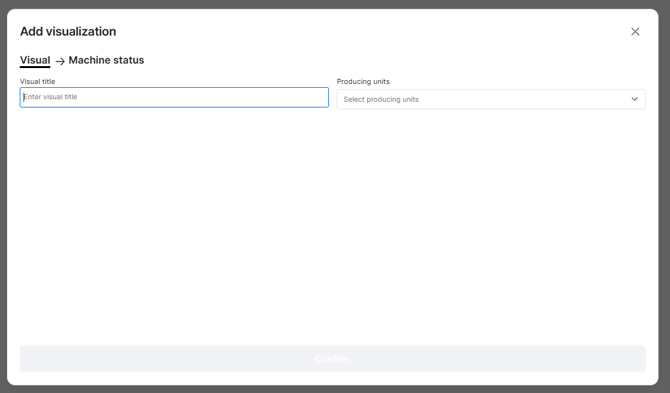
- Enter a Visual title.
- Under Producing units, select the machines or production units you want to display.
- Click Confirm to add the visualisation.
The selected machines will appear as individual status panels within the visualisation.
How to Use Machine Status in Daily Production
Monitor Production in Real Time
Display Machine Status on a production Dashboard or shared screen to give Operators and Production Leaders a quick overview of which machines are running.
Identify Machines Requiring Attention
Red status panels make stopped machines easier to identify.
The status duration helps determine how long a machine has been stopped, while the status text provides additional context.
Compare Performance with Targets
Each panel displays Shift OEE alongside its target.
This allows users to see whether a machine is currently meeting its expected production performance.
Support Daily Production Meetings
Use Machine Status during shift handovers or pulse meetings to review the current production situation and identify equipment that requires follow-up.
Tips for Getting More Value
- Group relevant machines together: Create visualisations for machines within the same production area.
- Use shared screens: Display Machine Status where Operators and Production Leaders can easily see it.
- Pay attention to stop duration: A stop that continues for several minutes may require investigation.
- Look beyond the current status: A running machine can still have low OEE because of earlier stops, reduced speed, or quality losses.
- Combine with other visualisations: Use Machine Status alongside production output, OEE, or stop reason visualisations for a more complete overview.
Key Takeaways
The Machine Status visualisation provides a quick, real-time overview of selected production units.
It combines machine status, status duration, Shift OEE, and OEE targets in a simple color-coded display.
Its main purpose is to help production teams quickly understand which machines are running, identify interruptions, and maintain awareness of current production performance.