
What Is the Metrics Table Visualisation?
The Metrics Table visualisation displays a selection of production metrics in a simple, easy-to-read format.
Instead of creating separate visualisations for each KPI, you can combine several metrics into one visualisation.
This makes it useful for Operators, Production Leaders, and Production Managers who want a quick overview of production efficiency, output, quality, and production time.
You can choose which metrics to include and which production units and time period the data should cover.
Understanding the Visualisation
Each selected metric is displayed with its name and corresponding value.
For example, a Metrics Table titled Production At a Glance might display:
| Metric | Value |
|---|---|
| OEE | 71.5% |
| OEE Target | 50% |
| Availability | 94.9% |
| Performance | 77.3% |
| Quality | 97.5% |
| Approved | 660 |
| Changeover Time | 4m 8s |
This provides a compact overview of several important production indicators.
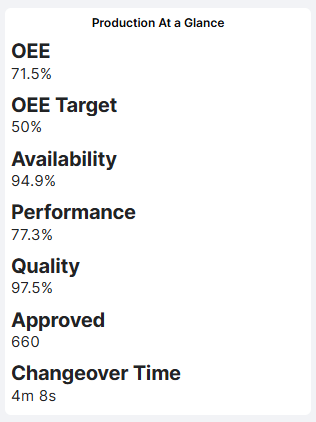
The values are displayed using the appropriate units, such as percentages, quantities, or time durations.
How to Add the Metrics Table Visualisation
- Open the Dashboard you want to configure.
- Enter Edit mode.
- Select Add visualisation.
- Choose Metrics Table.
- Enter a Visual title.
- Select the relevant Producing units.
- Choose the Time period.
- Add the metrics you want to display from Available metrics to Selected metrics.
- Click Confirm to add the visualisation to your Dashboard.
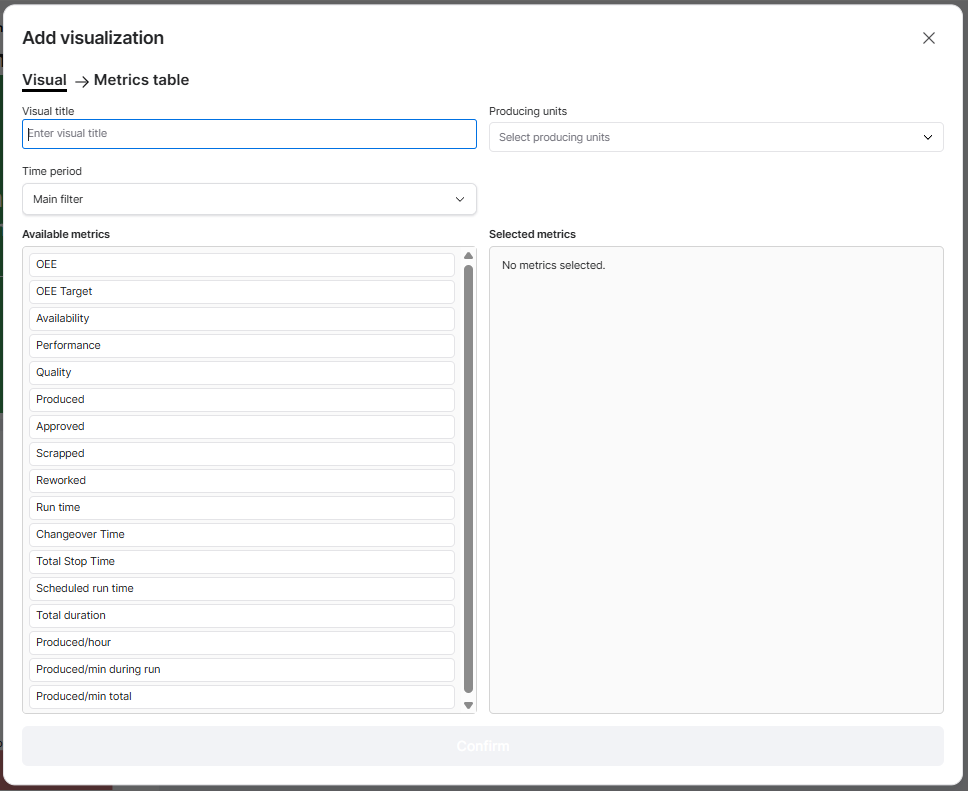
Configuring the Visualisation
| Setting | Description |
|---|---|
| Visual title | Enter a descriptive name, such as Production At a Glance, Shift Performance, or Quality Overview. |
| Producing units | Select the production units whose data should be included. |
| Time period | Choose the period used to calculate the displayed metrics. |
| Available metrics | Lists the production metrics you can add to the visualisation. |
| Selected metrics | Shows which metrics have been chosen for display. |
Selecting Metrics
The configuration screen contains two areas:
- Available metrics: All metrics available for selection.
- Selected metrics: The metrics that will appear in the visualisation.
Select the metrics that are relevant to your Dashboard.
For example, a Production Manager may want to display OEE, Availability, Performance, and Quality, while an Operator may benefit more from production quantities and production time.
Available Metrics
The Metrics Table supports a range of production metrics.
| Category | Available Metrics |
|---|---|
| Production Efficiency | OEE, OEE Target, Availability, Performance, Quality |
| Production Quantities | Produced, Approved, Scrapped, Reworked |
| Production Time | Run time, Changeover Time, Total Stop Time, Scheduled run time, Total duration |
| Production Speed | Produced/hour, Produced/min during run, Produced/min total |
Time Period
The Metrics Table can use the Dashboard's Main filter or an individually configured time period.
For example, your Dashboard may display current shift performance while a Metrics Table shows production results from the previous production day.
When an individual time period is selected, it overrides the Dashboard Time Filter for that visualisation.
Practical Examples
Example 1: Production Performance Overview
Configure the Metrics Table with:
- OEE
- OEE Target
- Availability
- Performance
- Quality
This provides a compact overview of production efficiency and helps users understand which OEE component may be affecting overall performance.
Example 2: Shift Production Summary
Select:
- Produced
- Approved
- Scrapped
- Reworked
- Run time
This gives Operators and Production Leaders an overview of production quantities and operating time during the selected shift.
Example 3: Monitor Production Losses
Select:
- Availability
- Changeover Time
- Total Stop Time
- Performance
This provides a quick summary of production interruptions and efficiency losses.
If the results indicate significant downtime, use the Stop Reasons visualisation or Availability Losses Report for further investigation.
Example 4: Quality Performance Overview
Select:
- Quality
- Produced
- Approved
- Scrapped
- Reworked
This helps production teams monitor quality performance and understand how much production is approved, scrapped, or reworked.
Tips for Getting More Value
- Keep the table focused: Select only the metrics needed for the intended audience.
- Group related metrics: Combine efficiency, production quantities, or quality metrics to create a clear overview.
- Use descriptive titles: Help users understand what information the visualisation contains.
- Choose relevant time periods: Current Shift is useful for operational monitoring, while longer periods support performance reviews.
- Combine with graphical visualisations: Use the Metrics Table alongside OEE Speedometers, Production charts, or Stop Reasons to provide both numerical and visual perspectives.
- Use consistent metrics: Display similar KPIs across Dashboards to make performance easier to understand.
Key Takeaways
The Metrics Table visualisation provides a flexible way to display multiple production metrics in one place.
You can customize the visualisation by selecting production units, choosing a time period, and deciding which metrics to include.
It supports production efficiency, quantities, time, and speed measurements.
Its main purpose is to provide a compact, easy-to-read overview of important production KPIs without requiring separate visualisations for each metric.