
What Is the OEE Bar Chart?
The OEE Bar Chart visualisation displays Overall Equipment Effectiveness (OEE) and its associated production losses in a stacked bar chart.
It helps Operators, Production Leaders, and Production Managers understand not only how efficiently equipment is performing, but also why production efficiency is below its potential.
Each selected production unit is represented by a separate bar, making it easy to compare machines and production lines.
Understanding the Visualisation
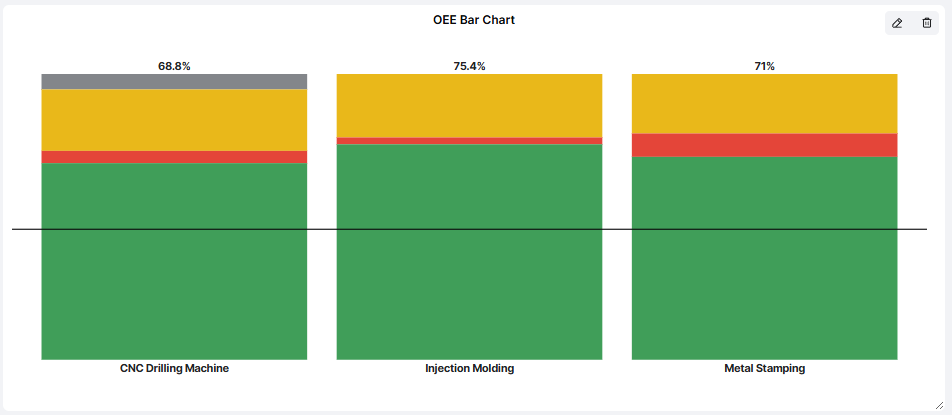
Each bar represents 100% of the production potential within the OEE calculation.
The bar is divided into colored sections showing effective production and different types of production losses.
| Color | Meaning |
|---|---|
| Green – OEE | The percentage of planned production time converted into good-quality production at the expected speed. |
| Red – Availability Loss | Production time lost because equipment is stopped. |
| Yellow – Performance Loss | Production capacity lost through reduced speed and other performance losses. |
| Grey – Quality Loss | Production capacity lost because products are scrapped or do not meet quality requirements. |
| Black Line – OEE Target | The target OEE level, providing a reference for comparing actual performance. |
The OEE percentage is displayed above each bar.
Example: Comparing Production Units
A Dashboard displays the following OEE results:
| Production Unit | OEE |
|---|---|
| CNC Drilling Machine | 68.8% |
| Injection Molding | 75.4% |
| Metal Stamping | 71.0% |
All three production units have different distributions of losses.
For example:
- CNC Drilling Machine has noticeable Performance and Quality losses.
- Injection Molding has relatively small Availability losses but more significant Performance losses.
- Metal Stamping has larger Availability losses than the other two machines.
Although Injection Molding has the highest OEE, its Performance losses still represent an opportunity for improvement.
Important: Two machines can have similar OEE percentages but very different loss distributions. Understanding these differences helps determine which improvement activities are most relevant.
How to Add the OEE Bar Chart
- Open the Dashboard you want to configure.
- Enter Edit mode.
- Select Add visualisation.
- Choose OEE Bar Chart.
- Configure the settings described below.
- Click Confirm to add the visualisation to your Dashboard.
Configuring the Visualisation
| Setting | Description |
|---|---|
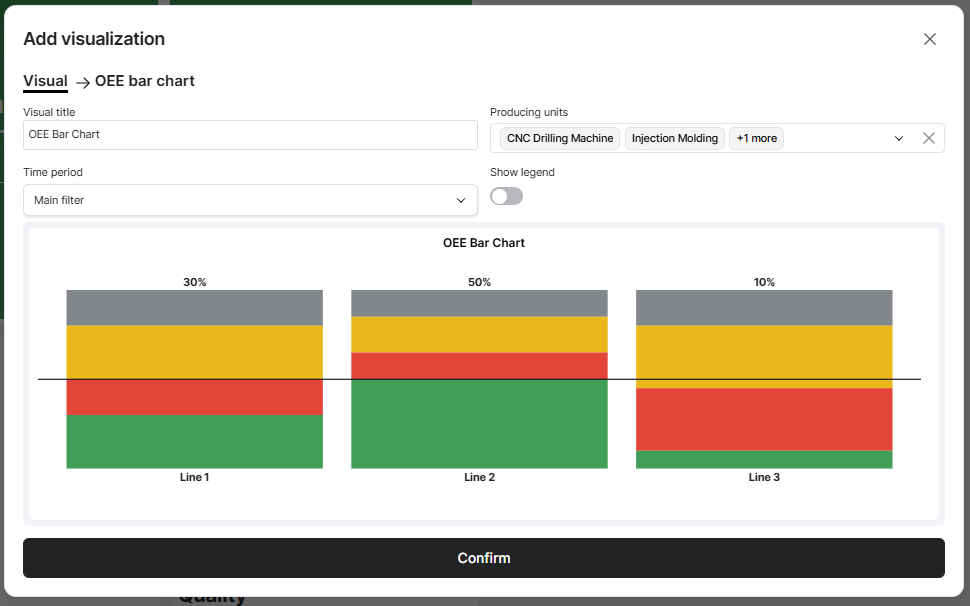
| Visual title | Enter a descriptive name, such as OEE Bar Chart or Production Efficiency. |
| Producing units | Select the machines or production lines you want to compare. |
| Time period | Choose the period used to calculate OEE and its losses. |
| Show legend | Choose whether to display a legend explaining the colors in the chart. |
Time Period
The visualisation can use the Dashboard's Main filter or an individually configured time period.
For example, your Dashboard may display current shift performance while the OEE Bar Chart shows results from the previous production day.
An individual time period overrides the Dashboard Time Filter for this visualisation.
Show Legend
Enable Show legend to display an explanation of the chart's colors.
This is particularly useful when the Dashboard is displayed on shared production screens or used by people who are less familiar with OEE.
Practical Examples
Example 1: Compare OEE Between Machines
Select several production units and use the current shift as the time period.
The chart displays each machine's OEE and loss distribution.
This helps Production Leaders quickly identify which machines are performing below expectations.
Example 2: Identify the Main Type of Production Loss
A production line has an OEE of 65%.
The chart reveals that most of the lost production potential comes from Performance losses rather than Availability losses.
Instead of focusing on machine breakdowns, the team can investigate reduced production speeds, cycle times, and microstoppages.
Example 3: Understand Differences Between Production Lines
Two production lines both have an OEE of 70%.
However:
- Line A has significant Availability losses caused by recurring machine stops.
- Line B has relatively high Availability but significant Performance losses.
Although their OEE results are identical, they require different improvement activities.
Example 4: Follow Up on Improvement Activities
A Production Manager wants to understand whether recent maintenance improvements have reduced Availability losses.
By reviewing the OEE Bar Chart for comparable periods, the team can evaluate whether the red portion of the bar has decreased and OEE has improved.
For more detailed historical analysis, use the OEE Report or Availability Losses Report.
Tips for Getting More Value
- Look beyond the OEE percentage: The distribution of losses is often more useful than the overall OEE value.
- Compare similar production conditions: Different Articles, schedules, and production requirements can influence OEE.
- Focus on the largest losses: Identify whether Availability, Performance, or Quality losses offer the greatest improvement potential.
- Use targets: The black target line helps users understand whether production is meeting expectations.
- Enable the legend when needed: Make the chart easy to interpret for everyone using the Dashboard.
- Combine with other visualisations: Use the OEE Bar Chart alongside Machine Status, Stop Reasons, or Production charts.
- Review during pulse meetings: Discuss which losses should be prioritized and follow up on improvement activities.
Key Takeaways
The OEE Bar Chart provides a visual breakdown of production efficiency and the losses affecting it.
Each production unit is displayed as a stacked bar showing OEE, Availability losses, Performance losses, and Quality losses.
The target line provides a reference for comparing actual production efficiency with expectations.
Its main purpose is to help production teams understand why OEE is below its potential and identify which types of losses should be prioritized for improvement.