
What Is the OEE Speedometer?
The OEE Speedometer visualisation displays Overall Equipment Effectiveness (OEE) using a simple, semicircular gauge.
It provides an easy-to-read overview of production efficiency, making it useful for Operators, Production Leaders, and Production Managers.
The visualisation can display OEE for a single production unit, multiple production units, or an aggregated result.
Understanding the Visualisation
The OEE Speedometer consists of several elements:
- OEE Value: The current OEE percentage, displayed prominently in the center.
- Gauge: A semicircular scale representing OEE from 0% to 100%.
- Green Area: Represents the achieved OEE percentage.
- Grey Area: Represents the remaining percentage up to 100%.
- Black Marker: Indicates the OEE target.
- Production Unit Name: Identifies the machine or production line when multiple units are displayed.
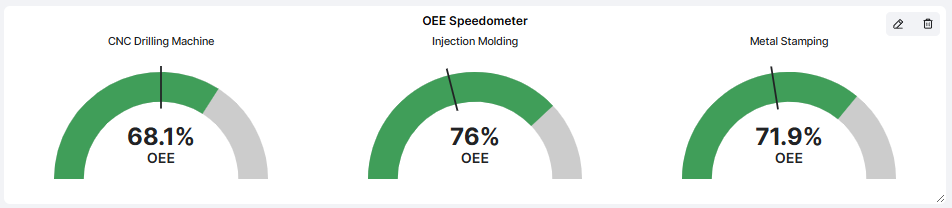
Example
A Dashboard displays OEE Speedometers for three production units:
| Production Unit | OEE |
|---|---|
| CNC Drilling Machine | 68.1% |
| Injection Molding | 76.0% |
| Metal Stamping | 71.9% |
Each production unit has its own speedometer, allowing users to compare performance.
The black target marker provides a visual reference for whether OEE is above or below the configured target.
Important: The green area represents achieved OEE, not necessarily performance above target. Compare the end of the green area with the black target marker to evaluate performance against the target.
How to Add the OEE Speedometer
- Open the Dashboard you want to configure.
- Enter Edit mode.
- Select Add visualisation.
- Choose Speedometer.
- Configure the settings described below.
- Click Confirm to add the visualisation to your Dashboard.
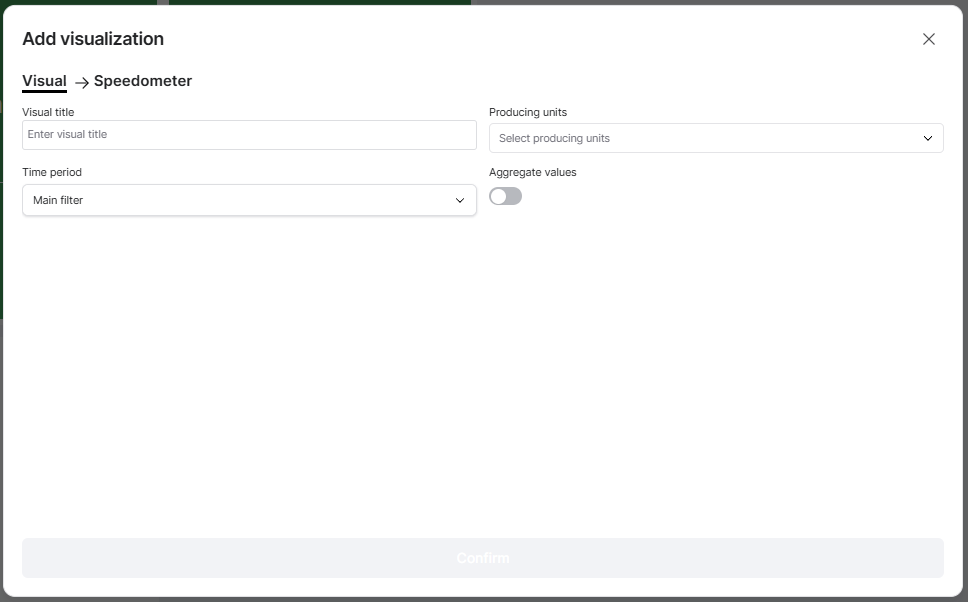
Configuring the Visualisation
| Setting | Description |
|---|---|
| Visual title | Enter a descriptive title, such as OEE Speedometer or Production Efficiency. |
| Producing units | Select one or several production units to include. |
| Time period | Choose the period used to calculate OEE. |
| Aggregate values | Choose whether to display individual OEE values or combine them into one aggregated result. |
Time Period
By default, the visualisation can use the Dashboard's Main filter.
You can also configure an individual time period that overrides the Dashboard Time Filter.
For example, your Dashboard may display current shift performance while the OEE Speedometer shows OEE for the previous production day.
Aggregate Values
The Aggregate values setting controls how OEE is presented when multiple production units are selected.
Aggregate values disabled:
Each selected production unit is displayed with its own OEE Speedometer.
This makes it easy to compare production efficiency between machines or production lines.
Aggregate values enabled:
The selected production units are combined into a single OEE Speedometer.
This provides an overall view of OEE for the selected production units.
Note: Aggregated OEE is calculated using Good Solutions' aggregation logic and should not be interpreted as a simple arithmetic average of individual OEE percentages.
Practical Examples
Example 1: Monitor Current Shift OEE
Configure the visualisation with:
- Producing units: One production line.
- Time period: Current Shift.
- Aggregate values: Disabled.
The speedometer displays the production line's OEE for the current shift, together with its target.
This helps Operators and Production Leaders quickly understand how production is performing.
Example 2: Compare Multiple Production Lines
Select three production lines and leave Aggregate values disabled.
Each line is displayed with its own speedometer.
This makes it easy to identify which production lines are performing above or below their targets.
Example 3: Monitor Overall Production Efficiency
Select all relevant production units and enable Aggregate values.
The visualisation displays one combined OEE value.
This is useful for management Dashboards where the focus is on overall production performance rather than individual machines.
Example 4: Follow Up on Daily Performance
Configure the OEE Speedometer to display the previous production day.
Use it during morning meetings to review whether production achieved its OEE target.
If OEE is below target, use the OEE Report or Timeline to investigate the underlying losses.
Tips for Getting More Value
- Use individual speedometers for comparisons: Display separate gauges when you want to identify differences between production units.
- Use aggregation for an overview: A combined OEE value is useful for monitoring overall performance.
- Compare against targets: The black marker makes it easier to see whether performance meets expectations.
- Choose relevant time periods: Current Shift is useful for operational monitoring, while previous-day or weekly results support performance reviews.
- Combine with other visualisations: Use the OEE Speedometer alongside Machine Status, Stop Reasons, or KPI Metrics.
- Investigate low OEE: Use Reports to understand whether Availability, Performance, or Quality losses are responsible.
Key Takeaways
The OEE Speedometer provides a simple visual overview of production efficiency.
It displays OEE as a percentage on a semicircular gauge, with a marker showing the configured target.
You can select production units, configure the time period, and choose between individual or aggregated OEE values.
Its main purpose is to make OEE performance easy to understand at a glance and help production teams identify when further investigation is needed.