
What Is the Production Visualisation?
The Production visualisation displays production quantities in a bar chart, making it easy to follow how production develops over time.
It helps Operators, Production Leaders, and Production Managers understand whether production is keeping up with expectations and identify periods where output is lower than planned.
The visualisation can display production data from one or several production units and supports four measurements: Approved, Produced, Reworked, and Scrapped.
Understanding the Visualisation
The Production visualisation displays:
- Bars: Production quantities for each displayed time interval.
- Time Axis: Shows when production occurred, for example by hour.
- Production Values: The quantity recorded for each interval, displayed above the bars.
- Target Line: A black line indicating the expected production level when applicable.
Production Status Colors
When displaying Approved production, colors help indicate performance against the production target.
| Color | Meaning |
|---|---|
| Green | Approved production has reached or exceeded the target for the completed time interval. |
| Red | Approved production is below the target for the completed time interval. |
| Blue | The current time interval is still ongoing, so its final performance against the target is not yet known. |
Important: The current hour is displayed in blue because production is still in progress. Even if the approved quantity is currently below the target, the final result cannot be determined until the hour is complete.
This distinction helps prevent users from interpreting an unfinished production hour as a confirmed production loss.
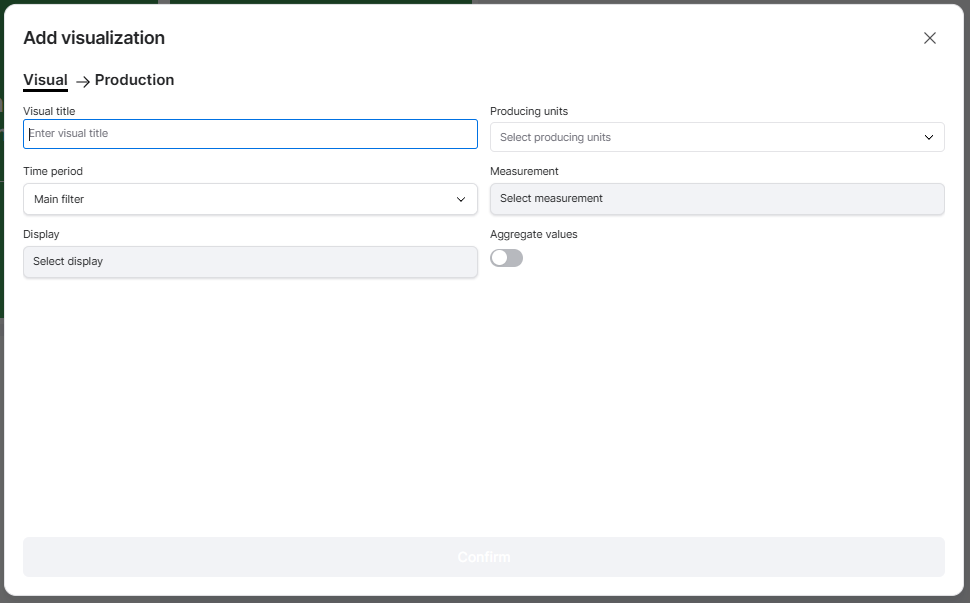
How to Add the Production Visualisation
- Open the Dashboard you want to configure.
- Enter Edit mode.
- Select Add visualisation.
- Choose Production.
- Configure the settings described below.
- Click Confirm to add the visualisation to your Dashboard.
Configuring the Visualisation
| Setting | Description |
|---|---|
| Visual title | Enter a descriptive name, such as Production, Hourly Output, or Approved Production. |
| Producing units | Select one or several production units to include. |
| Time period | Choose the period of production data to display. |
| Measurement | Select which production quantity to analyse. |
| Display | Select how production data should be presented over time. |
| Aggregate values | Choose between showing production for each individual time interval or showing accumulated production across the selected period. |
Selecting a Measurement
The visualisation supports four measurements:
| Measurement | Description |
|---|---|
| Approved | Number of approved units produced. |
| Produced | Total number of units produced. |
| Reworked | Number of units recorded as reworked. |
| Scrapped | Number of units recorded as scrap. |
Approved is particularly useful for monitoring production output against targets.
Scrapped and Reworked help production teams understand quality-related production quantities.
Time Period
The visualisation can use the Dashboard's Main filter or an individual time period.
For example, your Dashboard may display current shift performance while the Production visualisation shows output from the previous production day.
An individual time period overrides the Dashboard Time Filter for this visualisation.
Display
The Display setting determines the time intervals used to present production data.
For example, selecting Hour displays production quantities for individual hours.
This makes it possible to identify when production output increases, decreases, or falls below expectations.
Aggregate Values
The Aggregate values setting determines whether production quantities are displayed separately for each time interval or accumulated over the selected time period.
Aggregate values disabled:
Each bar shows the production quantity for that specific time interval.
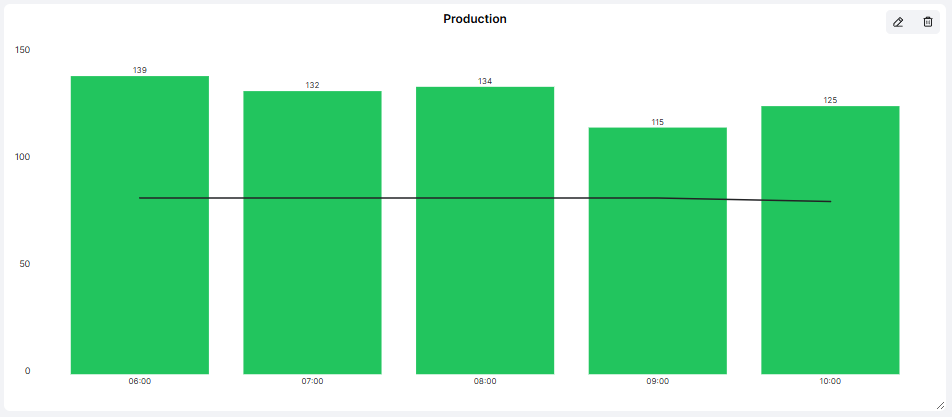
For example, when displaying production by hour:
| Hour | Approved Units |
|---|---|
| 06:00 | 139 |
| 07:00 | 132 |
| 08:00 | 134 |
| 09:00 | 115 |
| 10:00 | 125 |
This is useful for comparing production performance between individual hours and identifying periods with lower output.
Aggregate values enabled:
Each bar shows the accumulated production quantity up to that point in the selected time period.
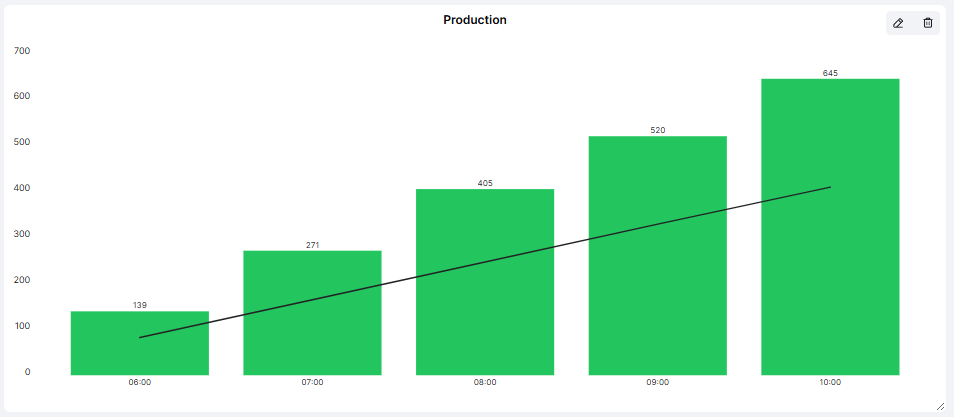
Using the same example:
| Hour | Accumulated Approved Units |
|---|---|
| 06:00 | 139 |
| 07:00 | 271 |
| 08:00 | 405 |
| 09:00 | 520 |
| 10:00 | 645 |
This is useful for monitoring total production progress throughout a shift or day.
The difference: Without aggregation, you see how much was produced during each hour. With aggregation, you see how much has been produced in total up to each hour.
The same principle applies when using other time intervals, such as days.
Practical Examples
Example 1: Monitor Hourly Production
Configure the visualisation with:
- Measurement: Approved
- Display: Hour
- Time period: Current Shift
- Aggregate values: Disabled
The chart displays approved production for each hour.
Completed hours are shown in green or red depending on whether the target was achieved, while the current hour remains blue.
This helps Operators and Production Leaders quickly identify periods where production fell behind.
Example 2: Follow Accumulated Production Output
Select:
- Measurement: Approved
- Display: Hour
- Time period: Current Shift
- Aggregate values: Enabled
The chart displays how approved production accumulates throughout the shift.
This helps production teams understand how total output develops compared with the expected production progress.
Example 3: Monitor Scrap Quantities
Select Scrapped as the measurement and disable aggregation.
The chart shows when scrap was recorded, helping Quality teams identify periods with unusually high scrap quantities.
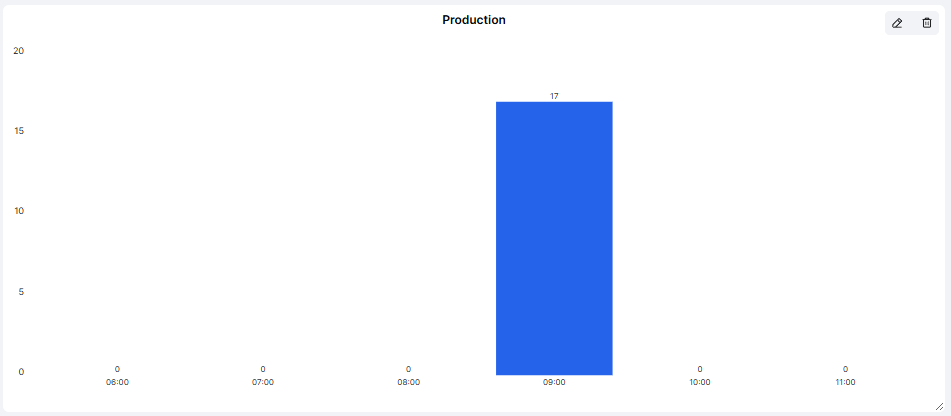
For a more detailed analysis of the causes, use the Scrap Reasons visualisation or Quality Report.
Example 4: Monitor Daily Production Progress
Configure the visualisation to display production by day.
With aggregation disabled, you can compare output between individual days.
With aggregation enabled, you can follow accumulated production across the selected period.
This can be useful when reviewing progress over a week or month.
Tips for Getting More Value
- Use Approved for target follow-up: Approved quantities show how much production meets quality requirements.
- Remember the blue current-hour bar: An ongoing interval should not be judged as a completed result.
- Use individual values to find problems: Disable aggregation when investigating which hours or days had unusually low production.
- Use accumulated values to follow progress: Enable aggregation when monitoring how total production develops over time.
- Compare similar production conditions: Different Articles and production units may have different expected production rates.
- Combine with Machine Status: Understand whether low production is related to equipment stops.
- Review during pulse meetings: Discuss completed periods below target and agree on relevant actions.
Key Takeaways
The Production visualisation helps production teams monitor output over time and compare approved production against targets.
It supports four measurements: Approved, Produced, Reworked, and Scrapped.
The Aggregate values setting provides two ways of viewing production:
- Disabled: Production quantities for each individual time interval.
- Enabled: Accumulated production quantities across the selected time period.
When displaying Approved production, green and red bars indicate whether completed intervals have achieved their targets, while blue indicates that the current interval is still ongoing.
Its main purpose is to make production progress visible, highlight confirmed production shortfalls, and help teams identify when further investigation is needed.