
What Is the Scrap Reasons Visualisation?
The Scrap Reasons visualisation provides an overview of why products are being scrapped during production.
By displaying scrap data grouped by reason, it helps Operators, Production Leaders, and Production Managers identify recurring quality problems and understand where improvements are needed.
The visualisation can include data from one or several production units over a selected time period.
Understanding the Visualisation
The Scrap Reasons visualisation helps you compare different causes of scrap.
Each reason represents a specific quality problem recorded during production, such as:
- Incorrect dimensions.
- Surface defects.
- Material defects.
- Damaged components.
- Incorrect machine settings.
By comparing scrap reasons, production teams can identify which problems contribute most to quality losses.
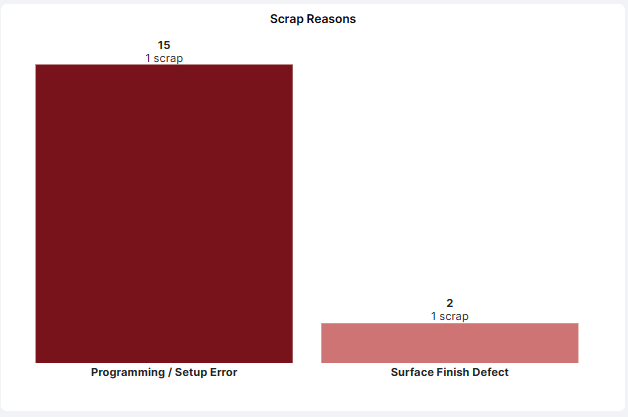
Example: A production line records 120 scrapped units during the previous week.
| Scrap Reason | Scrapped Units |
|---|---|
| Incorrect dimensions | 65 |
| Surface defects | 35 |
| Material defects | 20 |
| Total | 120 |
In this example, incorrect dimensions account for the largest amount of scrap and may be a suitable starting point for improvement activities.
The figures above are illustrative.
How to Add the Scrap Reasons Visualisation
- Open the Dashboard you want to configure.
- Enter Edit mode.
- Select Add visualisation.
- Choose Scrap Reasons.
- Configure the visualisation using the settings described below.
- Click Confirm to add it to your Dashboard.
Configuring the Visualisation
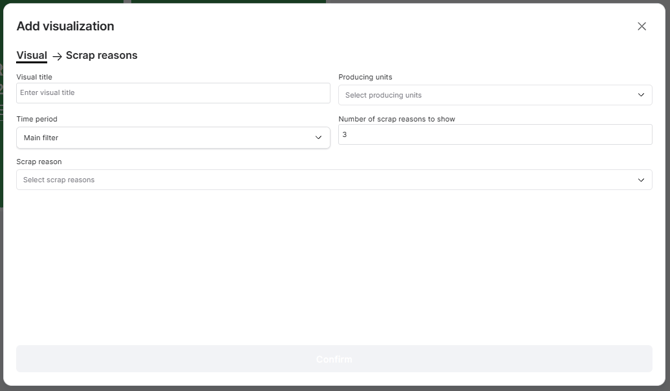
The following settings are available:
| Setting | Description |
|---|---|
| Visual title | Enter a descriptive name, such as Top Scrap Reasons or Quality Losses. |
| Producing units | Select one or several production units whose scrap data should be included. |
| Time period | Choose which period of production data to display. |
| Number of scrap reasons to show | Specify how many scrap reasons should appear in the visualisation. |
| Scrap reason | Select which scrap reasons should be included. |
Time Period
The visualisation can use the Dashboard's Main filter or an individually configured time period.
For example, your Dashboard may display current shift performance while the Scrap Reasons visualisation shows quality losses from the last seven days.
An individual time filter overrides the Dashboard's main time filter for that visualisation.
Number of Scrap Reasons to Show
This setting controls how many scrap reasons are displayed.
For example, entering 3 limits the visualisation to three scrap reasons, helping you focus on the most significant quality losses.
Selecting Scrap Reasons
Use the Scrap reason selector to choose which reasons should be included.
For example, you might create a visualisation focused on dimensional defects or surface quality problems.
Practical Examples
Example 1: Identify the Largest Quality Problems
Configure the visualisation to display the five largest scrap reasons across a production line.
During a daily production meeting, the team can identify which quality problems require attention and agree on corrective actions.
Example 2: Monitor a Specific Quality Problem
A factory experiences recurring surface defects.
Configure the visualisation to include the relevant scrap reasons and display data from the affected production units.
This provides a quick overview of the problem and supports regular follow-up.
Example 3: Compare Quality Losses Over Time
A Production Manager wants to understand whether a new quality control procedure has reduced scrap.
By reviewing scrap reasons over comparable time periods, the team can evaluate whether the number of scrapped units has decreased.
For more detailed historical analysis, use the Quality Report.
Example 4: Support Daily Quality Meetings
Display the Scrap Reasons visualisation alongside production output and OEE.
This allows the team to review production performance and quality losses together, helping them understand how scrap affects overall efficiency.
Tips for Getting More Value
- Focus on the largest losses: Display the top three to five scrap reasons for a clear overview.
- Ensure correct scrap coding: Accurate scrap reasons are essential for meaningful analysis.
- Compare similar production conditions: Different Articles may have different quality requirements and scrap patterns.
- Involve Operators and Quality teams: They often have valuable knowledge about the underlying causes of defects.
- Follow up on improvements: Review scrap data regularly to determine whether corrective actions are effective.
Key Takeaways
The Scrap Reasons visualisation helps production teams identify and monitor the causes of quality losses.
You can customize it by selecting production units, time periods, scrap reasons, and how many reasons to display.
Its main purpose is to make scrap losses visible and help teams focus improvement efforts on the quality problems that have the greatest impact on production.