
What Is the Stop Reasons Visualisation?
The Stop Reasons visualisation displays production stops in a bar chart, making it easy to see which stop reasons account for the most lost production time.
It helps Operators, Production Leaders, and Production Managers understand why production is stopping and which problems have the greatest impact.
The visualisation can display stop reasons from one or several production units over a selected time period.
Understanding the Visualisation
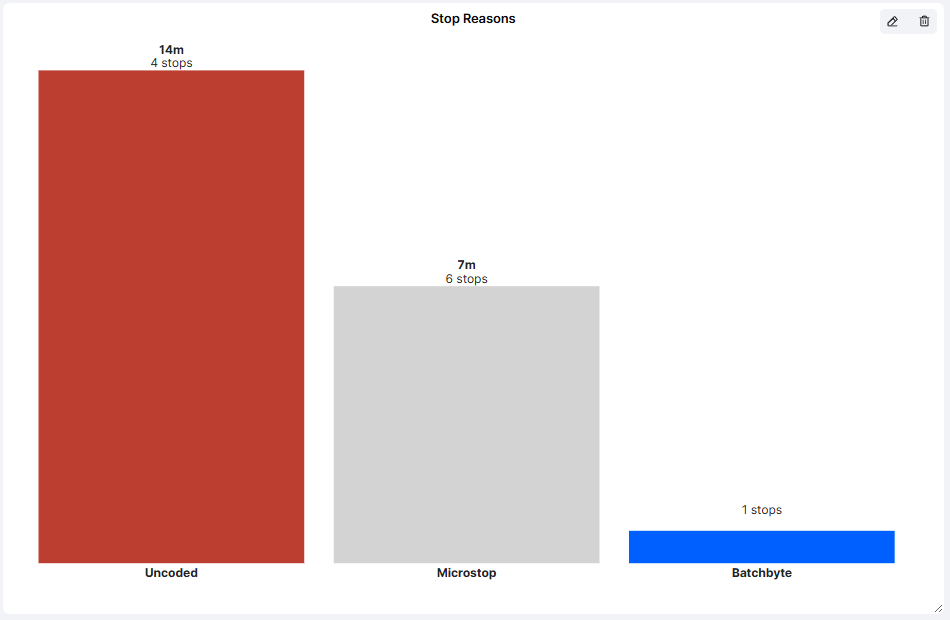
Each bar represents a stop reason and displays:
- Stop Reason: The name of the stop reason, shown below the bar.
- Total Stop Time: The accumulated downtime associated with that stop reason.
- Number of Stops: How many times the stop reason has occurred.
The height of each bar represents the total duration of the stops.
Example
In the example visualisation, three stop reasons are displayed:
| Stop Reason | Total Stop Time | Number of Stops |
|---|---|---|
| Uncoded | 14 minutes | 4 |
| Microstop | 7 minutes | 6 |
| Batchbyte (Batch Change) | Not displayed | 1 |
The example shows that uncoded stops account for the largest amount of downtime.
Although microstops occur more frequently, their combined duration is shorter.
Important: A stop reason with many occurrences does not necessarily cause the greatest production loss. Consider both total downtime and the number of stops when analysing the results.
How to Add the Stop Reasons Visualisation
- Open the Dashboard you want to configure.
- Enter Edit mode.
- Select Add visualisation.
- Choose Stop Reasons.
- Configure the settings described below.
- Click Confirm to add the visualisation to your Dashboard.
Configuring the Visualisation
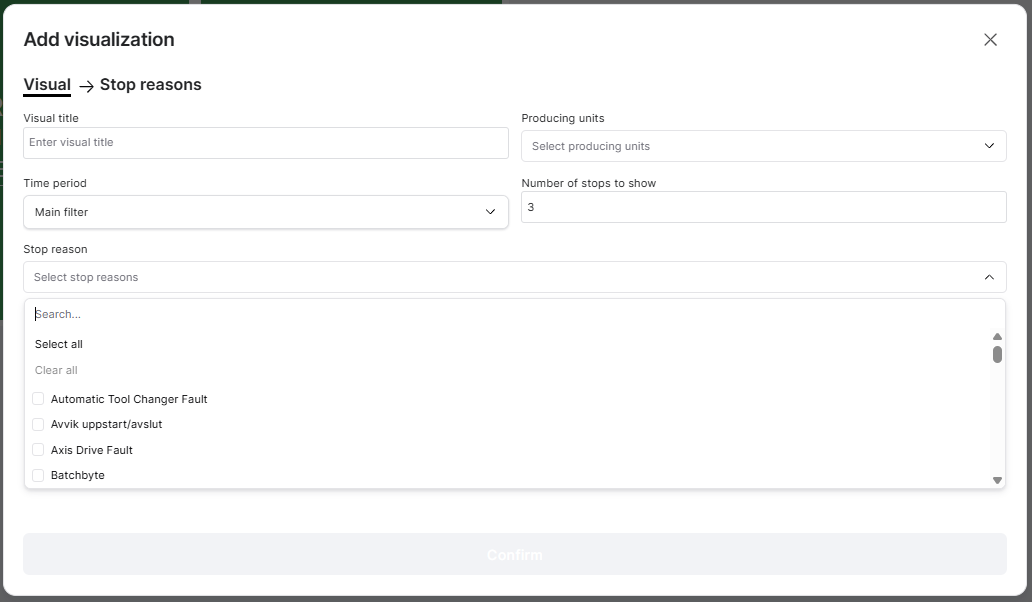
| Setting | Description |
|---|---|
| Visual title | Enter a descriptive name for the visualisation, such as Top Production Stops. |
| Producing units | Select one or several production units whose stops should be included. |
| Time period | Choose which period of production data to display. |
| Number of stops to show | Specify how many stop reasons should appear in the chart. |
| Stop reason | Select which stop reasons should be included in the analysis. |
Time Period
By default, the visualisation can use the Dashboard's Main filter.
You can also configure an individual time period to override the Dashboard Time Filter.
For example, your Dashboard might display current shift performance while the Stop Reasons visualisation shows downtime from the last seven days.
Number of Stops to Show
This setting controls how many stop reasons are displayed in the chart.
For example, entering 3 displays the three stop reasons with the greatest total downtime among the selected reasons.
This is useful when you want to focus attention on the most significant production losses.
Selecting Stop Reasons
Use the Stop reason selector to choose which stop reasons should be included.
You can search for individual reasons or use Select all and Clear all to manage the selection.
For example, you could create a visualisation focused specifically on technical breakdowns or material-related stops.
Practical ExamplesExample 1: Identify the Largest Downtime Causes
Configure the visualisation to display the five largest stop reasons across a production line.
During the morning meeting, the team can quickly identify which problems caused the most downtime and decide which require investigation.
Example 2: Compare Stop Frequency and Duration
A machine has two recurring problems:
- Material shortage: 3 stops totaling 45 minutes.
- Sensor fault: 15 stops totaling 20 minutes.
The material shortages cause more lost production time, while the sensor faults occur more frequently.
Both may require attention, but the appropriate improvement activities will differ.
Example 3: Monitor Uncoded Stops
Include Uncoded among the selected stop reasons.
If uncoded stops account for a significant amount of downtime, Operators and Production Leaders can review and categorize these stops to improve production data quality.
Example 4: Follow Up on Improvements
Configure the visualisation to show the most significant stop reasons over a longer period.
After implementing corrective actions, review whether the total downtime associated with a particular stop reason has decreased.
For more detailed historical comparisons, use the Availability Losses Report.
Tips for Getting More Value
- Focus on the largest losses: Display the top three to five stop reasons for a clear overview.
- Consider both duration and frequency: Long stops and frequent short interruptions may require different solutions.
- Keep stop reasons updated: Correct stop coding improves the reliability of the visualisation.
- Use relevant production units: Group machines or production lines that share similar processes.
- Combine with Machine Status: Monitor current machine conditions alongside recurring downtime causes.
- Review regularly: Use the visualisation during pulse meetings to identify and follow up on improvement priorities.
Key Takeaways
The Stop Reasons visualisation helps production teams understand which stop reasons account for the most downtime.
By displaying total stop time and the number of occurrences, it provides a quick overview of recurring production problems.
You can customize the visualisation by selecting production units, time periods, stop reasons, and how many reasons to display.
Its main purpose is to make production losses visible and help teams focus on the interruptions that have the greatest impact on production.