
What is the Timeline?
The Timeline in Good Solutions provides a visual overview of production activities over time.
It helps you understand when machines have been running, when production stops have occurred, and how production activities have developed during a selected period.
The Timeline allows you to:
- View production activities across one or several Measure Points.
- Identify production stops and understand when they occurred.
- Choose which production information to display.
- Navigate through historical production data.
- Investigate individual stops and their underlying reasons.
Step 1: Open the Timeline
- Log in to Good Solutions
- Select Timeline from the main navigation menu.
The Timeline opens, allowing you to configure which production information you want to explore.
Step 2: Select a Time Period
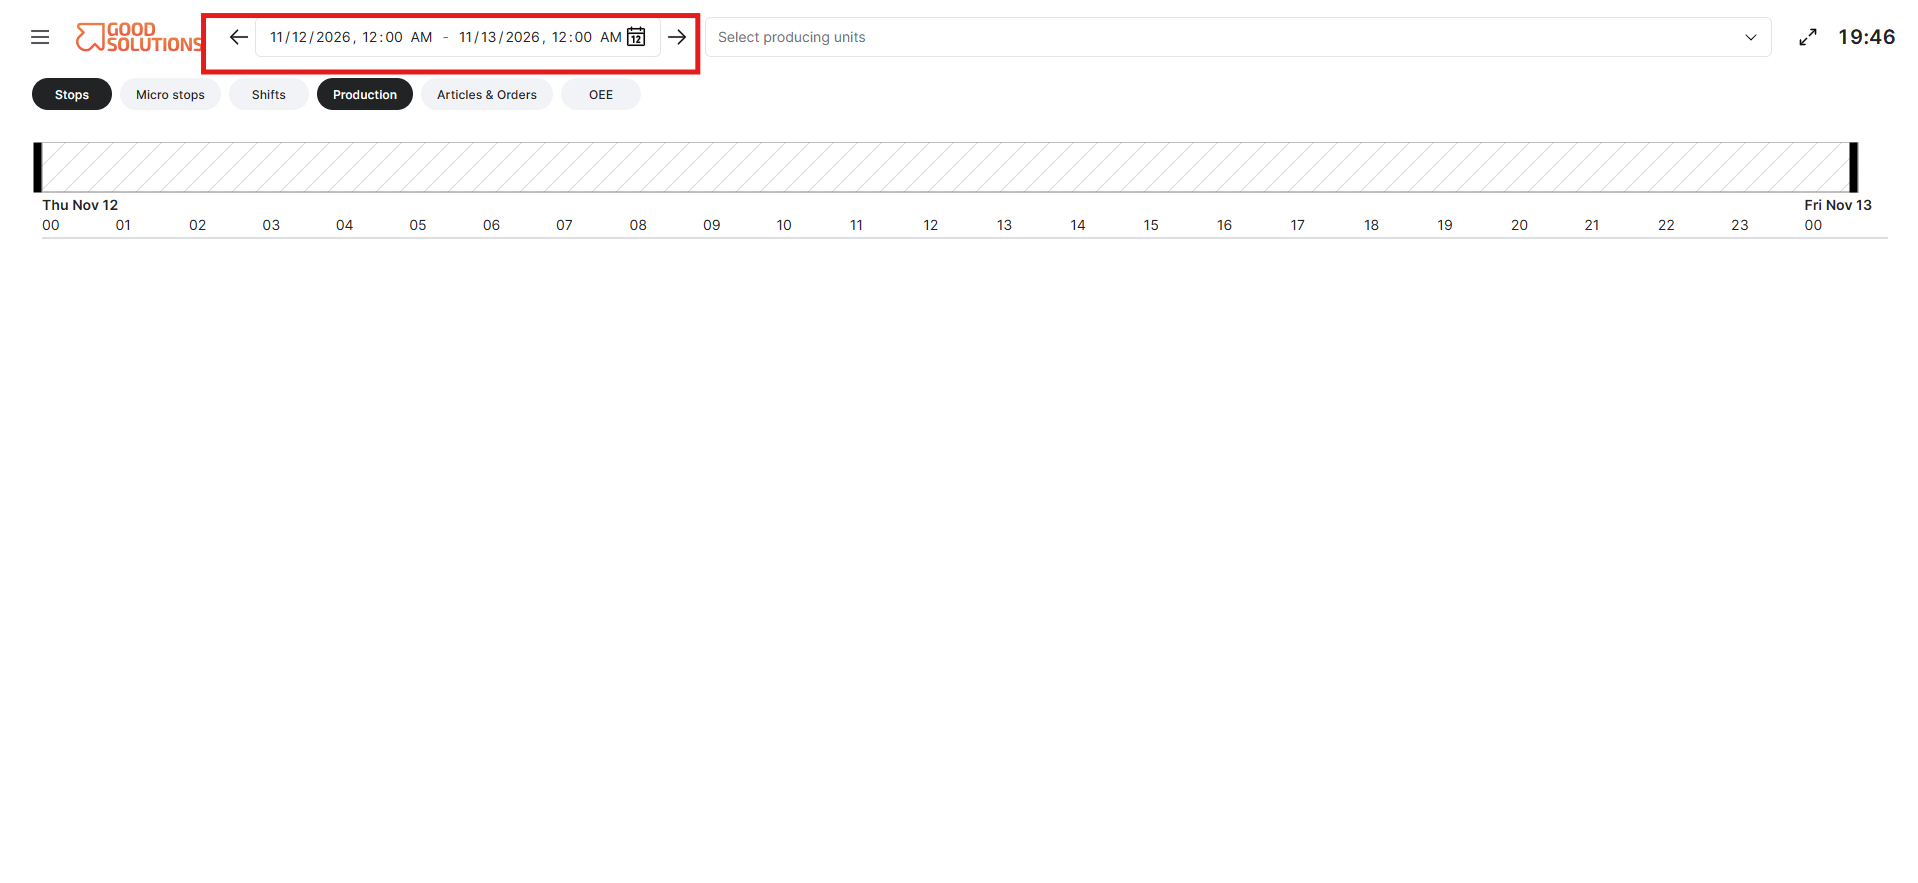
Start by selecting the period you want to analyse.
- Locate the Time selection in the Timeline.
- Choose the period you want to review.
- Apply your selection to display production activities for that period.
Depending on the available options, you can select a relative time period or a specific date range.
For example, you might want to review:
- The current production day.
- The previous production day.
- The last seven days.
- A specific historical date or period.
Tip: Start with a shorter time period when investigating individual production events. Longer periods are useful for identifying recurring patterns.
Step 3: Select Measure Points
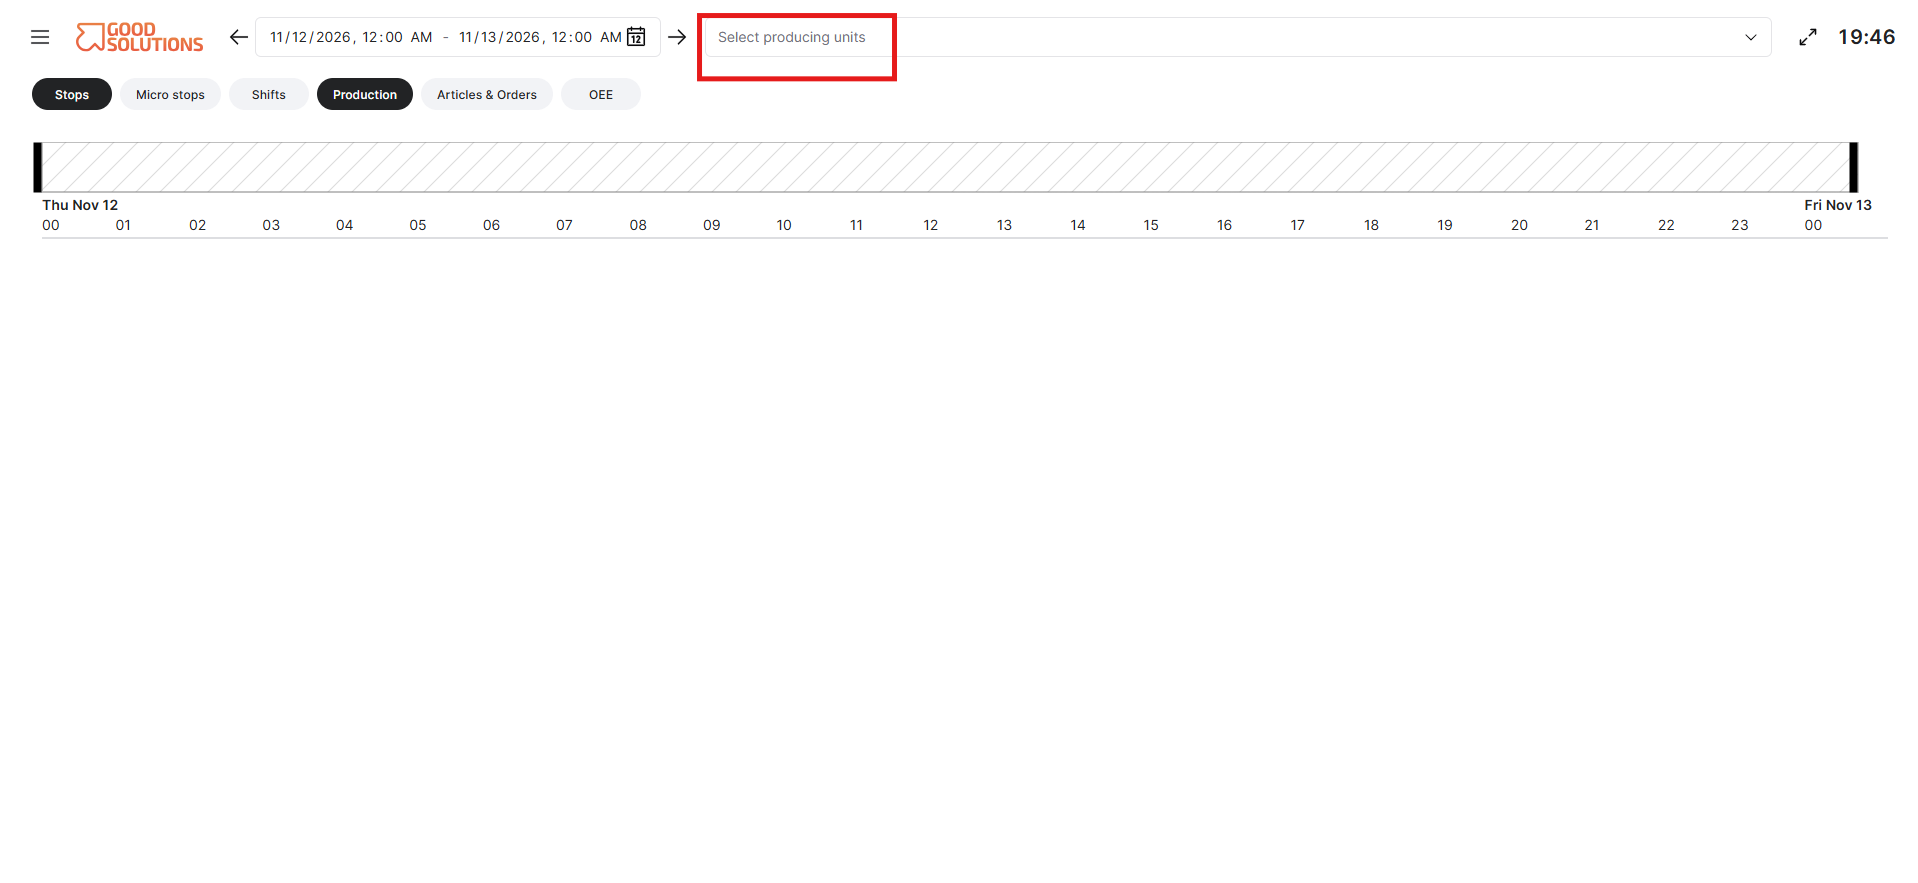
Next, choose which machines or production lines you want to display.
- Open the Measure Point selection.
- Select one or several Measure Points.
- Apply your selection.
The Timeline displays production activities for the selected Measure Points.
You can use this to focus on a specific machine or compare production activities across multiple machines.
For example, selecting several Measure Points can help you identify whether production interruptions occurred simultaneously across different parts of your production environment.
Tip: Start with one Measure Point when investigating a specific production issue. Add more Measure Points when you want to compare activities.
Step 4: Choose What Information to Display
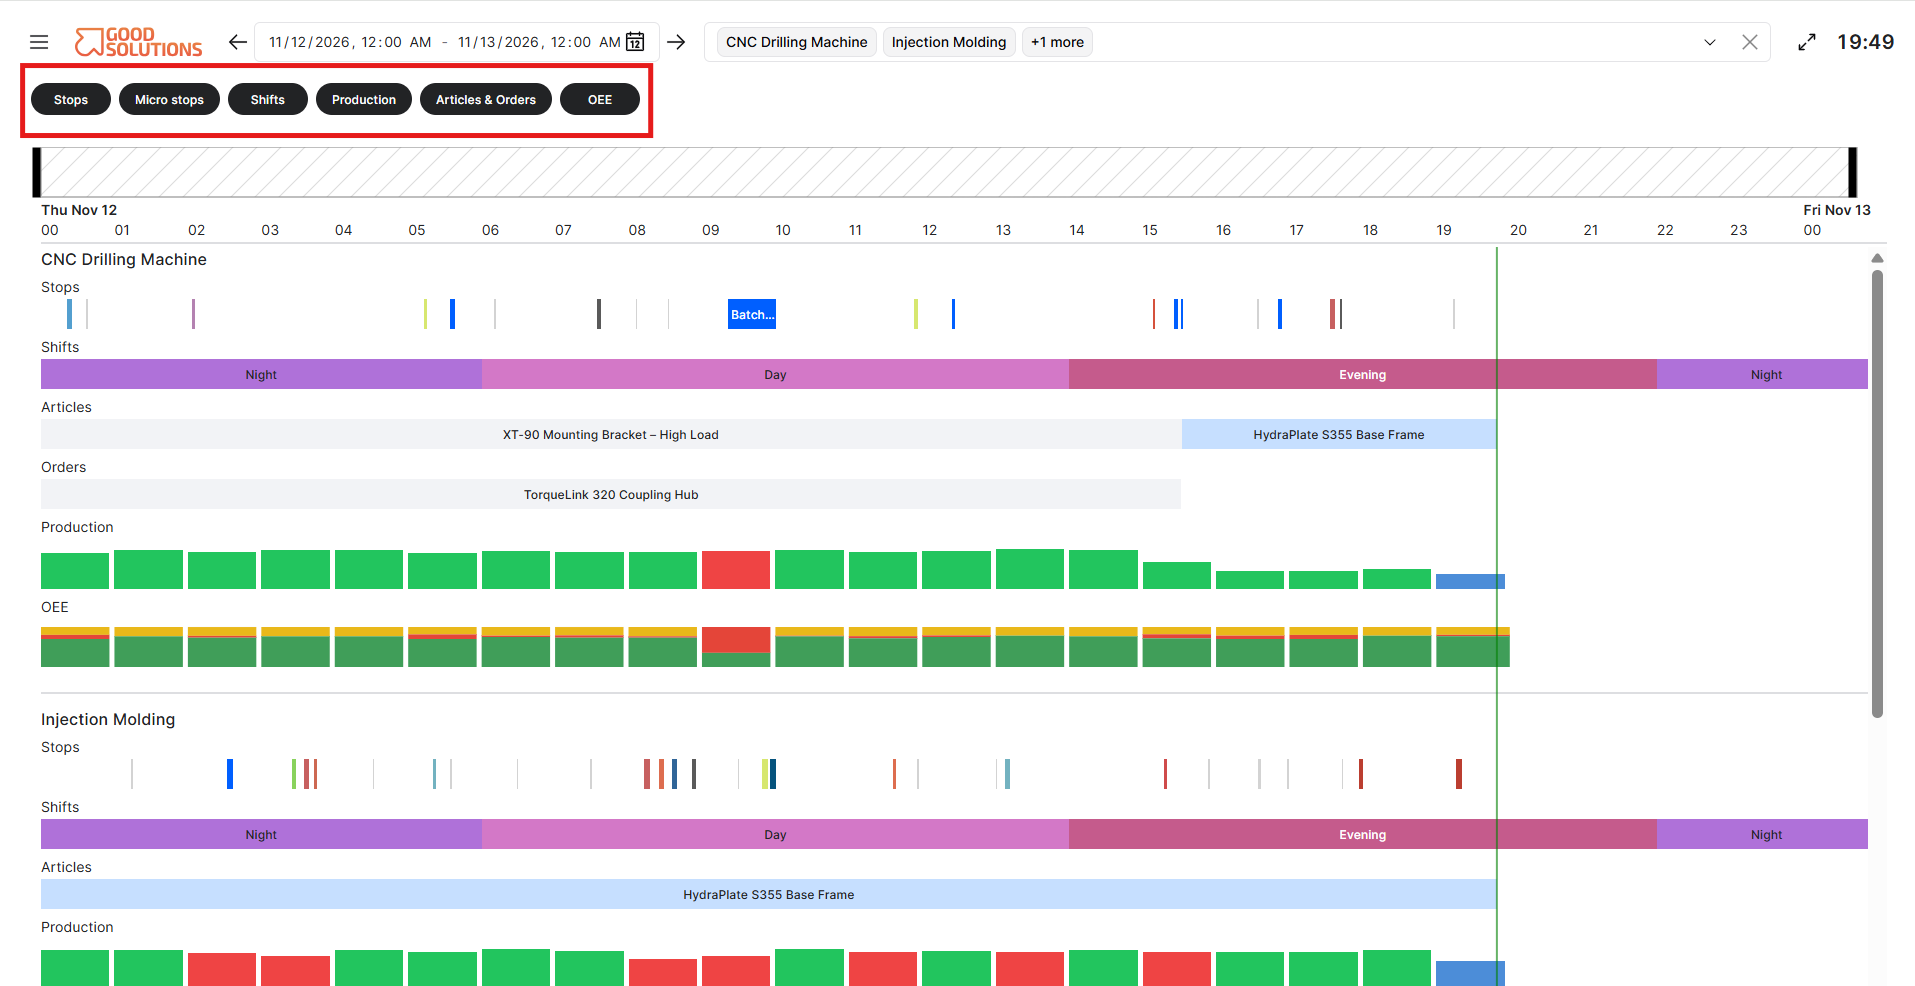
The Timeline allows you to control which types of production information are visible.
Use the available display options or toggles to show or hide information according to what you want to investigate.
Depending on the available Timeline configuration, this may include:
- Production stops: Display interruptions in production.
- Stop reasons and categories: Show how production stops have been classified.
- Articles: Display information about which Articles were being produced.
- Orders: Show production Orders associated with the selected period.
- Shifts: Display shift information to provide additional production context.
For example, if you want to investigate machine downtime, focus on production stops and their categories.
If you want to understand which products were manufactured during a particular period, display Article and Order information.
Tip: Start with the information most relevant to your analysis. Hiding unnecessary information can make the Timeline easier to understand.
Step 5: Understand the Timeline
Once you have selected your time period, Measure Points, and display options, review the Timeline.
Production activities are presented along a horizontal time axis.
Each selected Measure Point displays its production activity over time.
Different colours and segments help distinguish between production states and stop categories.
For example:
- Running periods: Show when the machine was producing.
- Stop periods: Show when production was interrupted.
- Categorized stops: Use colours to distinguish different types of production losses.
- Uncategorized stops: Indicate stops that have not yet been assigned a reason.
The length of each segment represents its duration.
A long stop segment indicates an extended production interruption, while several short segments may indicate recurring minor stops.
Step 6: Navigate and Zoom in the Timeline
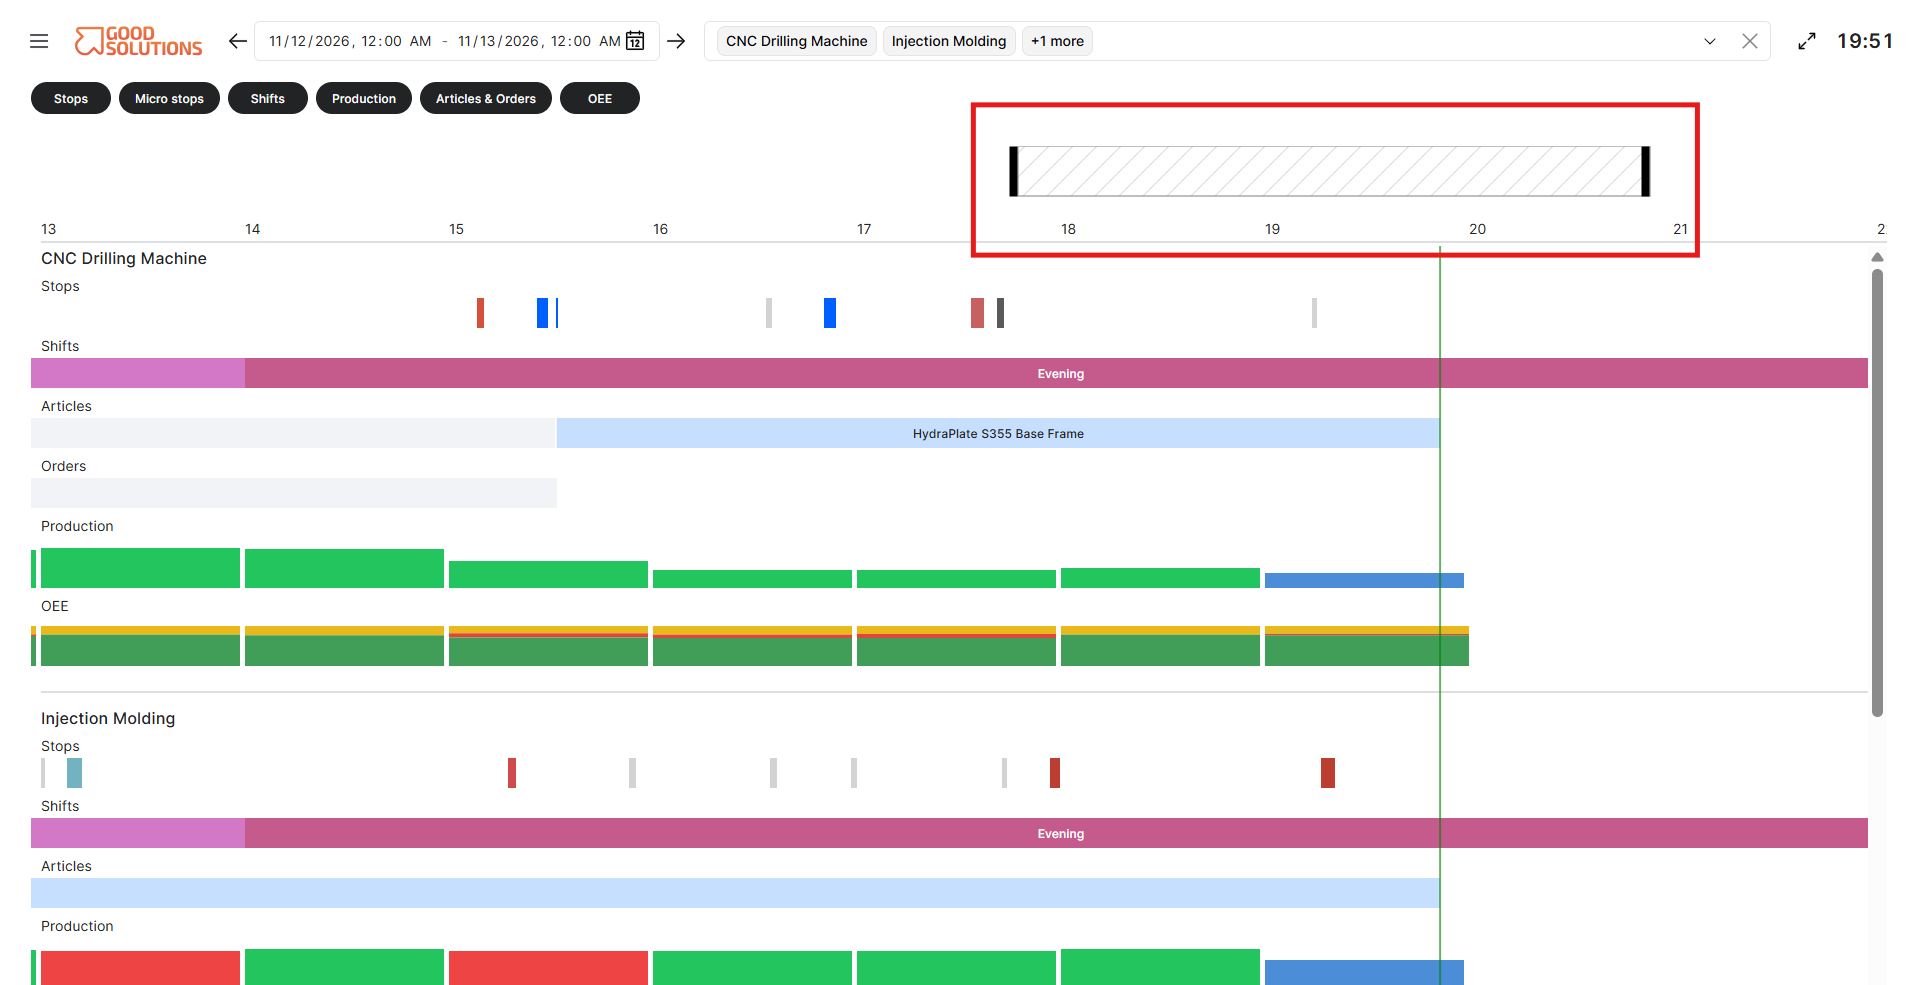
Use the Timeline navigation controls to explore production activities in more detail.
Depending on the available controls, you can:
- Zoom in: Examine shorter time periods and individual production events.
- Zoom out: Get a broader overview of production activities.
- Navigate horizontally: Move backward or forward through time to explore earlier or later events.
For example, if you notice several stops during the morning shift, zoom in to examine when they occurred and how long they lasted.
Tip: Use a broader view to identify interesting periods, then zoom in to investigate individual events.
Step 7: Investigate Production Stops
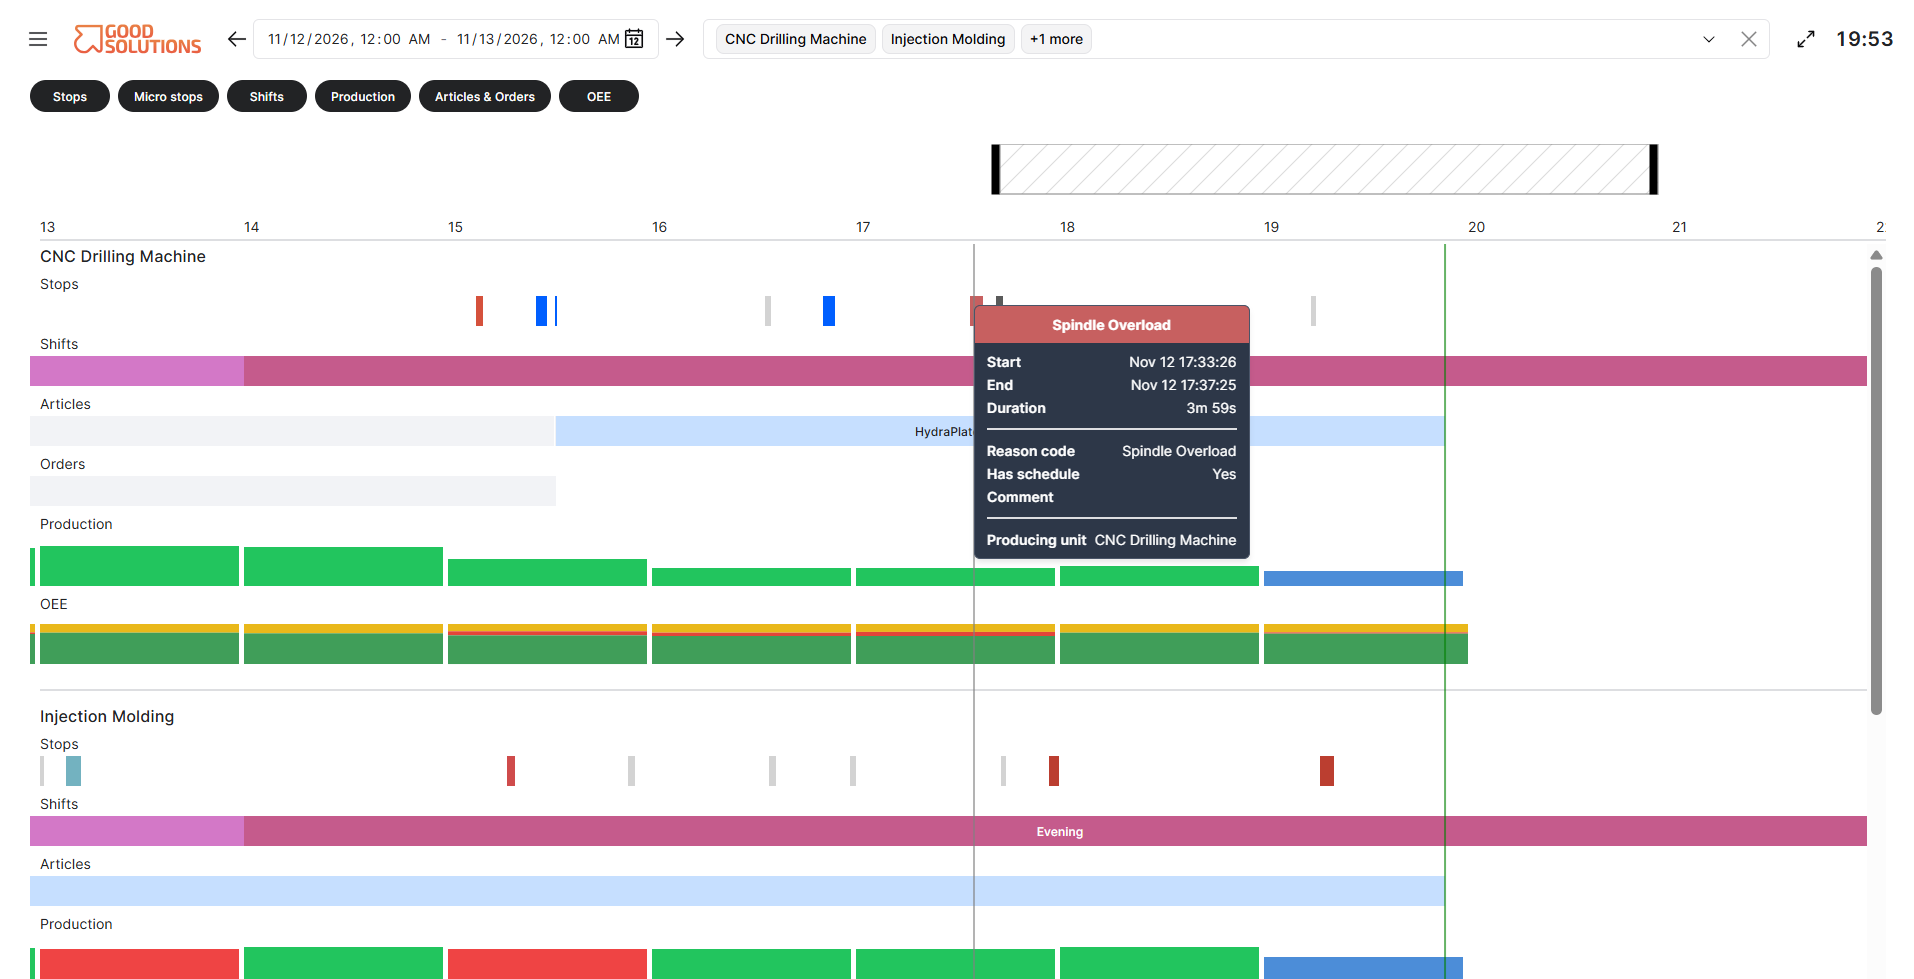
Production stops are displayed as segments in the Timeline.
To investigate a stop:
- Locate the stop you want to review.
- Click the stop segment.
- Review the available information about the event.
Depending on the stop, this may include:
- Start and end time.
- Stop duration.
- Stop reason.
- Stop category.
- Associated production information.
This helps you understand when production was interrupted and what caused the interruption.
Uncategorized stops
Some stops may not yet have an assigned stop reason.
These are uncategorized stops and indicate that additional information is needed to understand the production loss.
Reviewing and categorizing these stops helps improve the accuracy of production reporting.
Step 8: Code or Split Production Stops
Where editing is available, you can use the Timeline to update information about production stops.
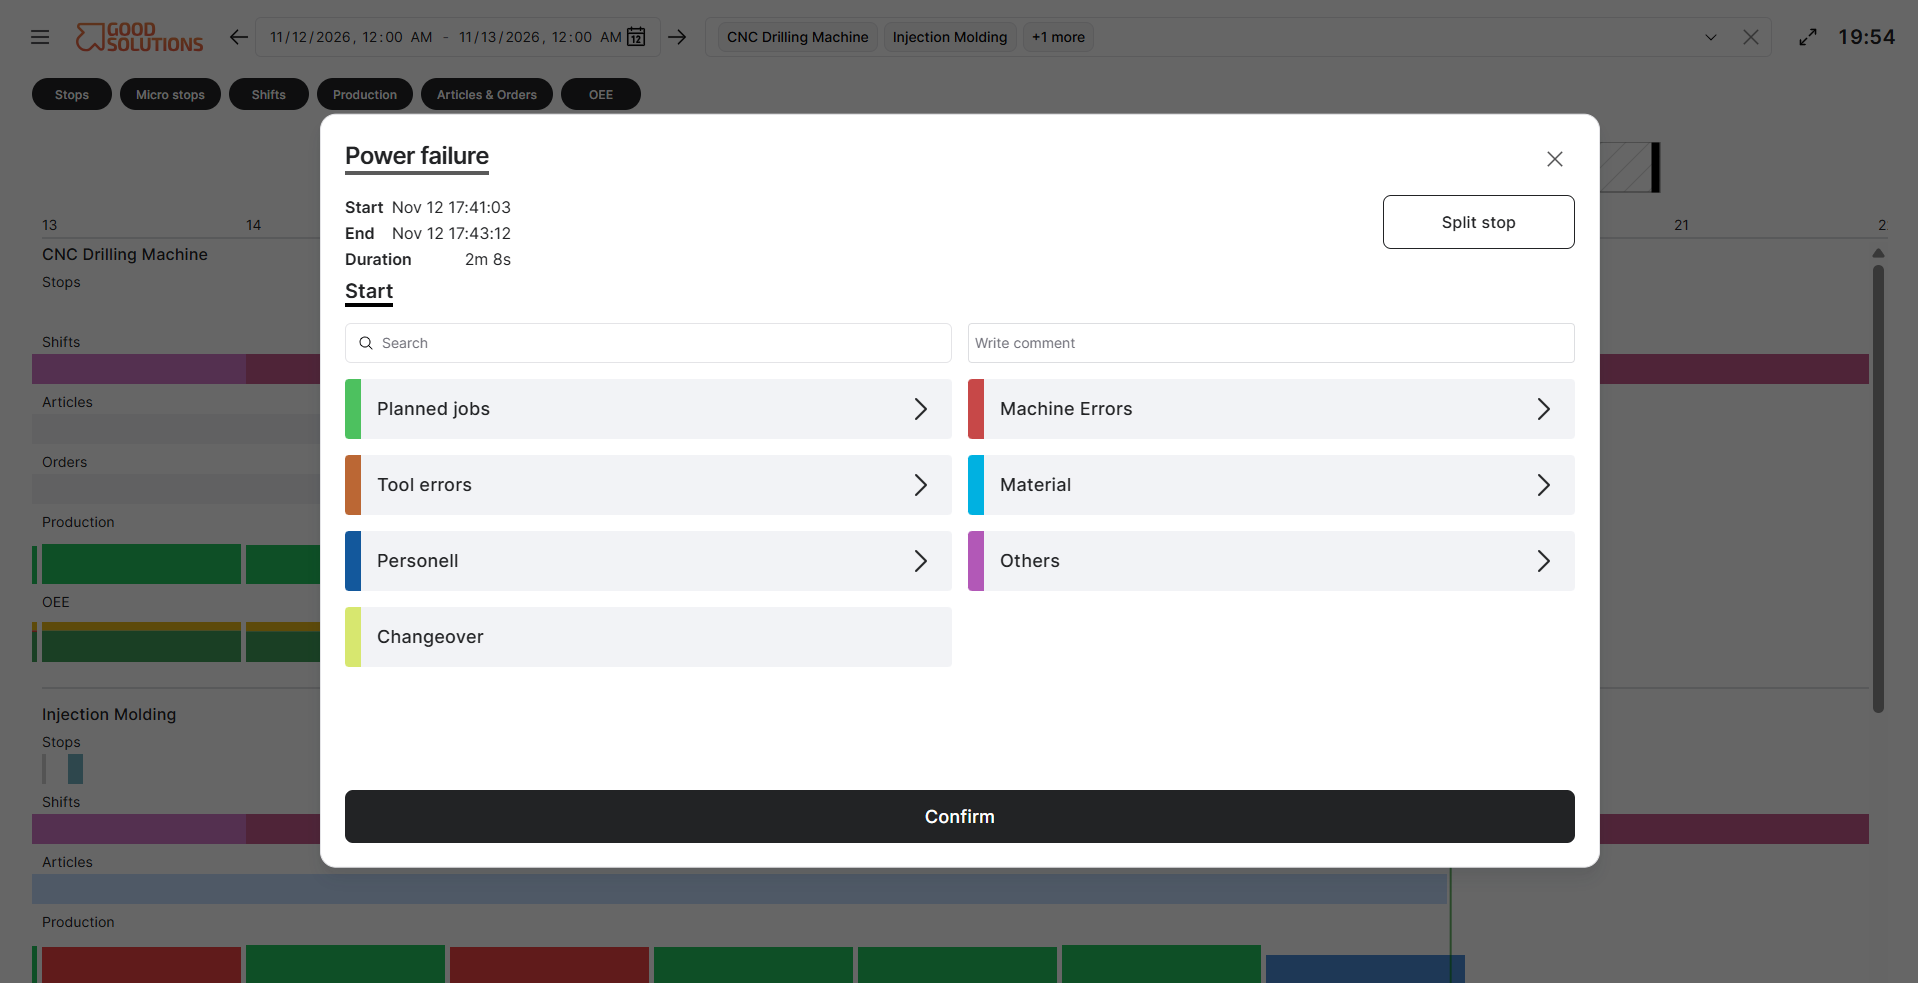
Click a stop to access the available stop management options.
Depending on your permissions, you may be able to:
- Code a stop: Assign the appropriate stop reason.
- Change a stop reason: Correct an existing classification.
- Split a stop: Divide a longer interruption into separate events with different causes.
For example, a machine might initially stop due to a mechanical problem but remain stopped because materials are unavailable.
Splitting the stop allows you to record these as separate production losses, providing a more accurate understanding of what happened.
Step 9: Identify Production Patterns
Once you have configured and explored the Timeline, look for patterns that may indicate opportunities for improvement.
For example:
- Frequent short stops occurring throughout a shift.
- Long production interruptions on a particular Measure Point.
- Similar stops occurring across several machines.
- Recurring interruptions around shift changes.
- Periods with little or no production activity.
Use these observations to identify areas that may require further investigation.
Tip: Combine Timeline analysis with the Availability Loss Report to understand both when production stops occurred and how much time was lost to different stop reasons.
Tips for Using the Timeline
- Start with Time: Always verify that you are analysing the correct period.
- Select relevant Measure Points: Focus on the machines you want to investigate.
- Configure display options: Show only the production information relevant to your analysis.
- Use zoom and navigation: Move between an overall view and detailed production events.
- Investigate stops: Click individual stops to understand their duration and cause.
- Review uncategorized stops: Ensure production interruptions are correctly classified.
- Look for recurring patterns: Use the Timeline to identify opportunities for continuous improvement.