
What is the Production Overview Report?
The Production Overview Report provides an overview of production performance across your manufacturing operations.
It brings together important production metrics, helping Production Managers and other users understand how efficiently production is running and where improvements may be needed.
The report helps you:
- Monitor production performance: Review key production metrics for a selected period.
- Compare Measure Points: Identify differences in performance between machines and production lines.
- Analyse production output: Understand how much has been produced and how production time has been used.
- Identify improvement opportunities: Find production areas with lower performance or significant losses.
- Follow up on results: Use production data to support daily meetings and continuous improvement activities.
Step 1: Open the Production Overview Report
- Log in to Good Solutions
- Navigate to Reports in the main menu.
- Select Production Overview.
The report displays production information for the selected reporting period and production areas.
Step 2: Select a Time Period
Use the Filters panel to choose the period you want to analyse.
For example, you can select:
- Previous Production Day
- Current Production Day
- Past 7 Days
- Current Week
- Custom date range
The report updates to reflect production data from the selected period.
Tip: Use Previous Production Day when reviewing results during daily production meetings. Longer periods are useful for identifying trends and recurring performance problems.
Step 3: Filter Production Data
Use the report filters to focus on specific parts of your production environment.
Depending on the report configuration, available filters may include:
- Section: Select a particular production area.
- Measure Point: Focus on specific machines or production lines.
- Shift: Review production during selected shifts.
- Article: Analyse production associated with particular products.
- Order: Focus on specific production orders.
You can combine filters to narrow your analysis.
For example, select a Measure Point and Shift to review how a particular machine performed during the evening shift.
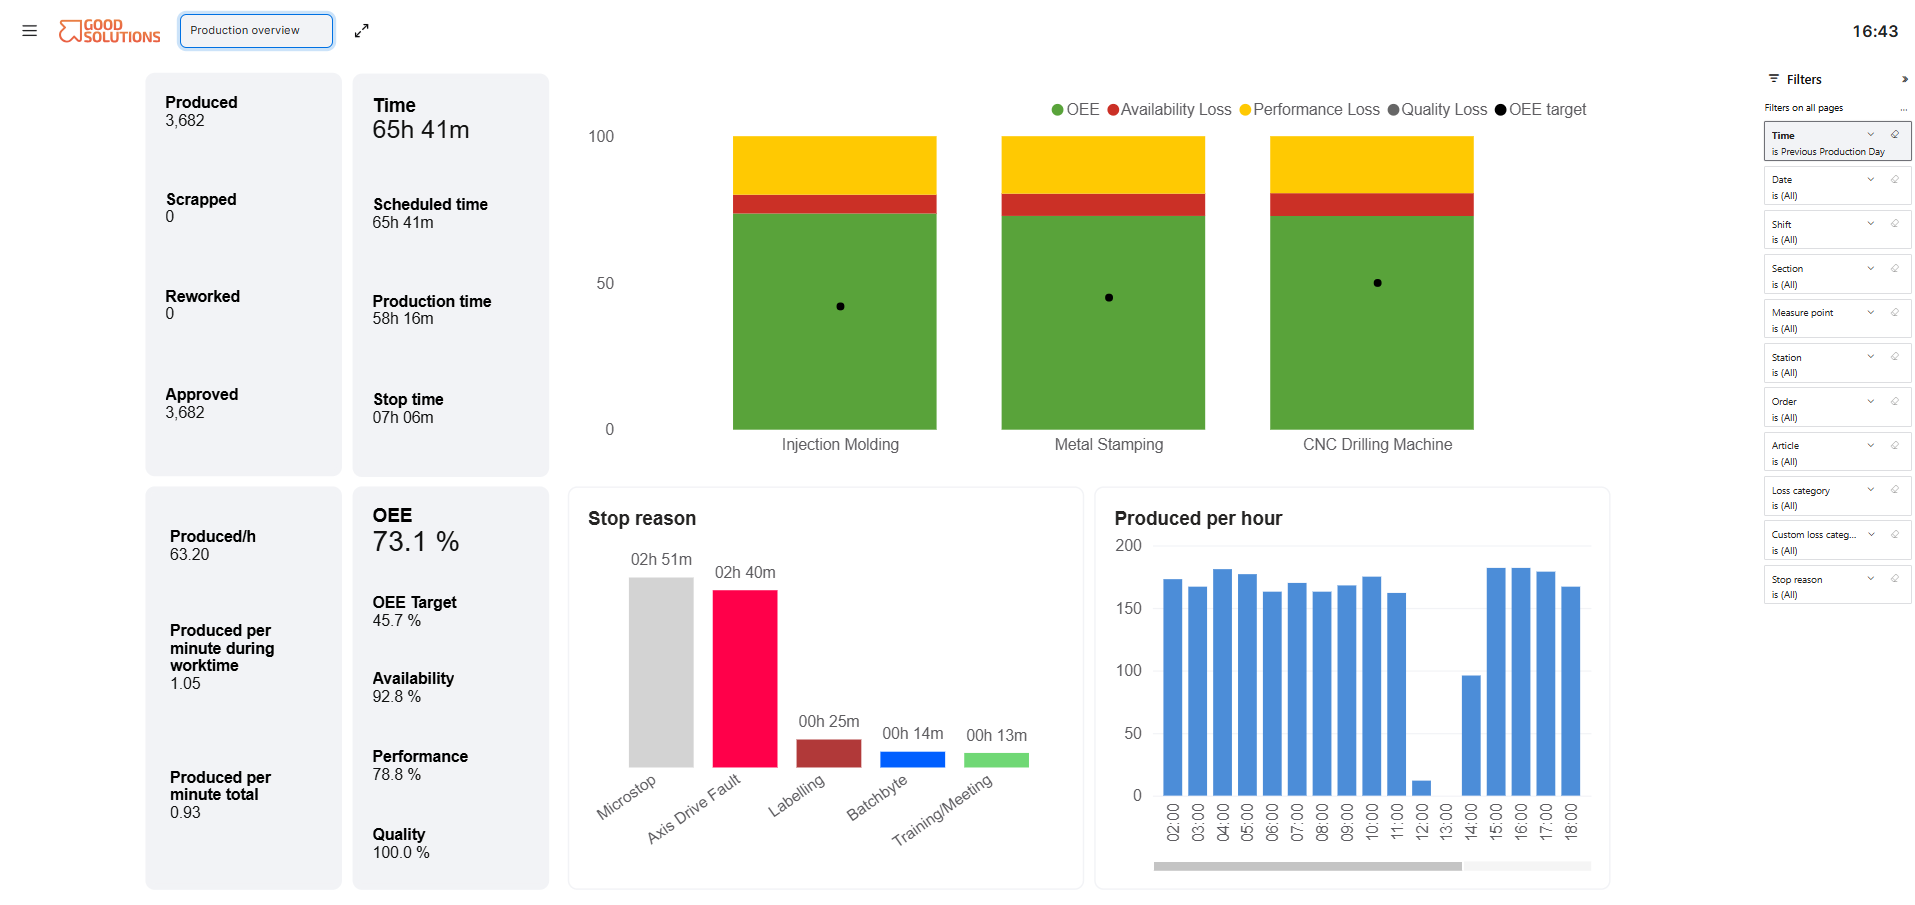
Step 4: Understand Production Metrics
The Production Overview Report brings together production data to help you understand how your manufacturing operations are performing.
Depending on the report configuration, you may encounter metrics such as:
| Metric | Description |
|---|---|
| OEE | Overall Equipment Effectiveness, combining Availability, Performance, and Quality. |
| Availability | The proportion of planned production time during which equipment was running. |
| Performance | How efficiently equipment operated compared with its expected production speed. |
| Quality | The proportion of production meeting quality requirements. |
| Produced Amount | The total quantity produced during the selected period. |
| Approved Amount | The quantity of production approved as good output. |
| Scrap | The quantity of products recorded as scrap. |
| Production Time | The time associated with actual production activities. |
| Stop Time | The time lost due to production stops. |
These metrics provide different perspectives on production performance and help you understand where losses occur.
Step 5: Compare Production Across Measure Points
One of the main uses of the Production Overview Report is comparing production performance between different machines or production lines.
For example, you might notice that:
- One Measure Point consistently achieves higher OEE than others.
- A particular machine experiences significantly more stop time.
- Production output varies between Measure Points.
- Quality losses are concentrated in a specific production area.
Use the available tables and visualisations to identify these differences.
Tip: When comparing Measure Points, consider differences in production conditions, Articles, and scheduled operating time. These factors can influence the results.
Step 6: Identify Production Losses
Production performance is influenced by three main types of losses:
Availability Losses
Time lost when equipment is not producing during scheduled production time.
Examples include machine breakdowns, material shortages, and changeovers.
Performance Losses
Losses caused by equipment operating below its expected production speed.
Examples include reduced running speed and minor interruptions.
Quality Losses
Production that does not meet quality requirements.
Examples include scrap and rejected products.
By reviewing these areas, you can identify which type of loss has the greatest impact on your production performance.
For more detailed investigations, use the dedicated OEE and Availability Loss reports.