
What are Report Filters?
Report Filters allow you to control which production data is displayed in your reports.
By applying filters, you can narrow your analysis to specific parts of your production environment, making it easier to investigate performance, identify losses, and compare results.
For example, you can use filters to:
- Analyse OEE for a specific machine or production line.
- Compare production performance between shifts.
- Investigate production stops associated with a particular Article.
- Review losses during a selected time period.
- Focus on specific stop reasons or loss categories.
Filters help you move from an overall production overview to a more detailed analysis.
Step 1: Open Report Filters
- Navigate to Reports in Good Solutions Web.
- Open the report you want to analyse.
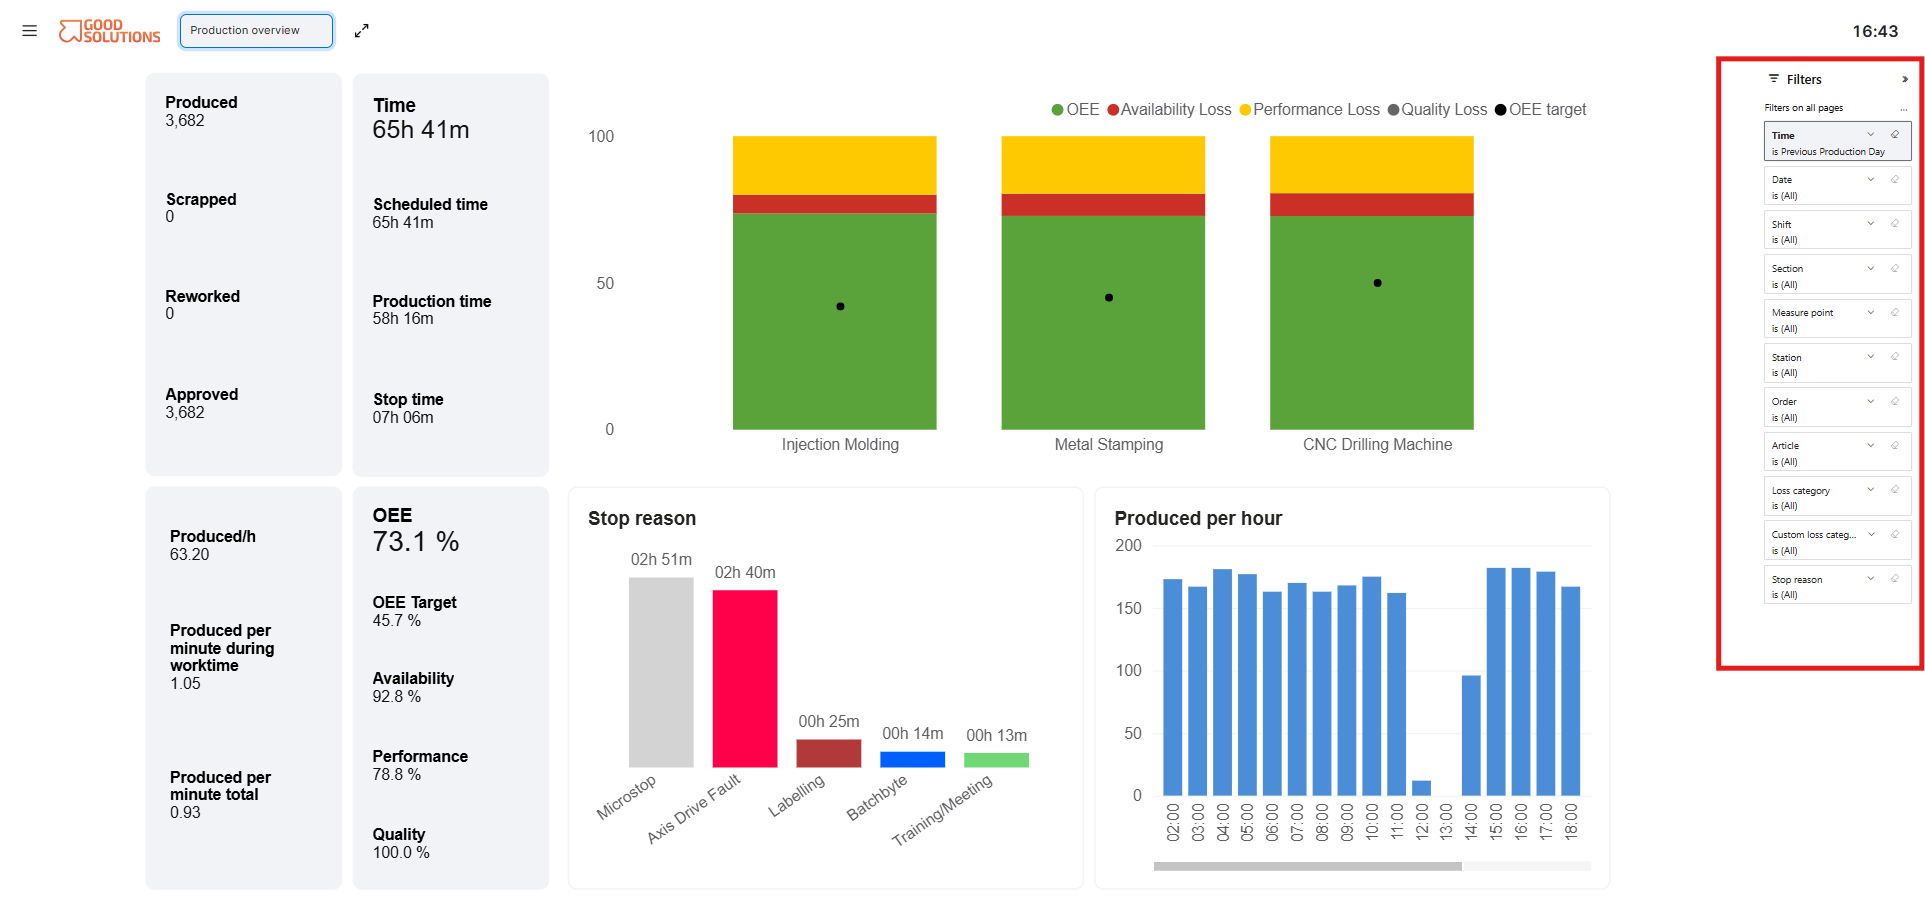
- Locate the Filters panel.
- Expand the panel if it is collapsed.
The Filters panel displays the available filtering options for the selected report.
Step 2: Select a Time Period
The Time filter determines which period of production data is included in the report.
You can select a relative time period, such as:
- Previous Production Day
- Current Production Day
- Past 7 Days
- Current Week
- Previous Month
You can also use the Date filter to select a specific date or date range.
For example, selecting Previous Production Day allows you to review production performance from the most recently completed production day.
Tip: Use relative time filters for recurring analysis, such as daily production meetings. Use specific dates when investigating historical production events.
Step 3: Apply Production Filters
Depending on the report, you can filter production data using different dimensions.
| Filter | Description |
|---|---|
| Time | Select a relative reporting period. |
| Date | Select specific dates or a date range. |
| Shift | Focus on production during selected shifts. |
| Section | Analyse a particular production area or section. |
| Measure Point | Focus on specific machines or production lines. |
| Station | Filter data by production station. |
| Order | Analyse production associated with selected Orders. |
| Article | Focus on production of specific Articles. |
| Loss Category | Analyse selected categories of production losses. |
| Custom Loss Category | Filter using your organization's configured loss categories. |
| Stop Reason | Focus on specific reasons for production stops. |
The available filters may vary depending on the selected report.
Step 4: Select Filter Values
To apply a filter:
- Click the filter you want to configure.
- Select the relevant value or values.
- Confirm your selection if required.
- Review the updated report.
For example, to analyse a specific machine:
- Open the Measure Point filter.
- Select the machine you want to analyse.
- The report updates to show production data associated with that Measure Point.
When a filter displays (All), no specific selection is restricting the data for that dimension.
Step 5: Combine Multiple Filters
You can combine several filters to perform more detailed analyses.
For example, imagine you want to investigate production stops on a specific machine during the evening shift.
You could configure:
- Time: Past 7 Days
- Measure Point: CNC Drilling Machine
- Shift: Evening
- Stop Reason: Mechanical Failure
The report will then focus on production data matching these selections.
Combining filters helps you identify patterns that may not be visible when analysing all production data together.
Tip: Start with a broad view and gradually add filters to narrow your analysis. This makes it easier to understand where performance losses originate.
Step 6: Clear or Change Filters
You can change your filter selections at any time.
To remove a filter:
- Locate the filter you want to clear.
- Click the Clear icon next to the filter.
- The filter returns to its default selection, typically (All).
You can also select different values to adjust your analysis.
For example, after reviewing the Evening shift, you could change the Shift filter to Day to compare production performance.
Tips for Using Report Filters
- Start with Time: Always verify that you are analysing the correct reporting period.
- Use Measure Point filters: Focus on individual machines or production lines when investigating problems.
- Combine filters: Narrow your analysis using Shift, Article, Order, or Stop Reason.
- Switch report: Change report and maintain the same filter.
- Check active filters: Remember that previous selections may affect the data you are viewing.
- Clear filters when needed: Return to a broader overview before starting a new analysis.
- Use consistent filters for comparisons: Apply the same selections when comparing performance across different periods.