
What Is the OEE Report?
The OEE Report provides an overview of how effectively your production equipment is being used.
OEE (Overall Equipment Effectiveness) measures production efficiency by combining three factors:
- Availability: How much of the planned production time equipment is actually producing.
- Performance: How efficiently equipment produces compared with its expected speed.
- Quality: How much of the production output meets quality requirements.
OEE = Availability × Performance × Quality
The report helps you understand not only how production is performing, but also which losses are preventing you from achieving higher efficiency.
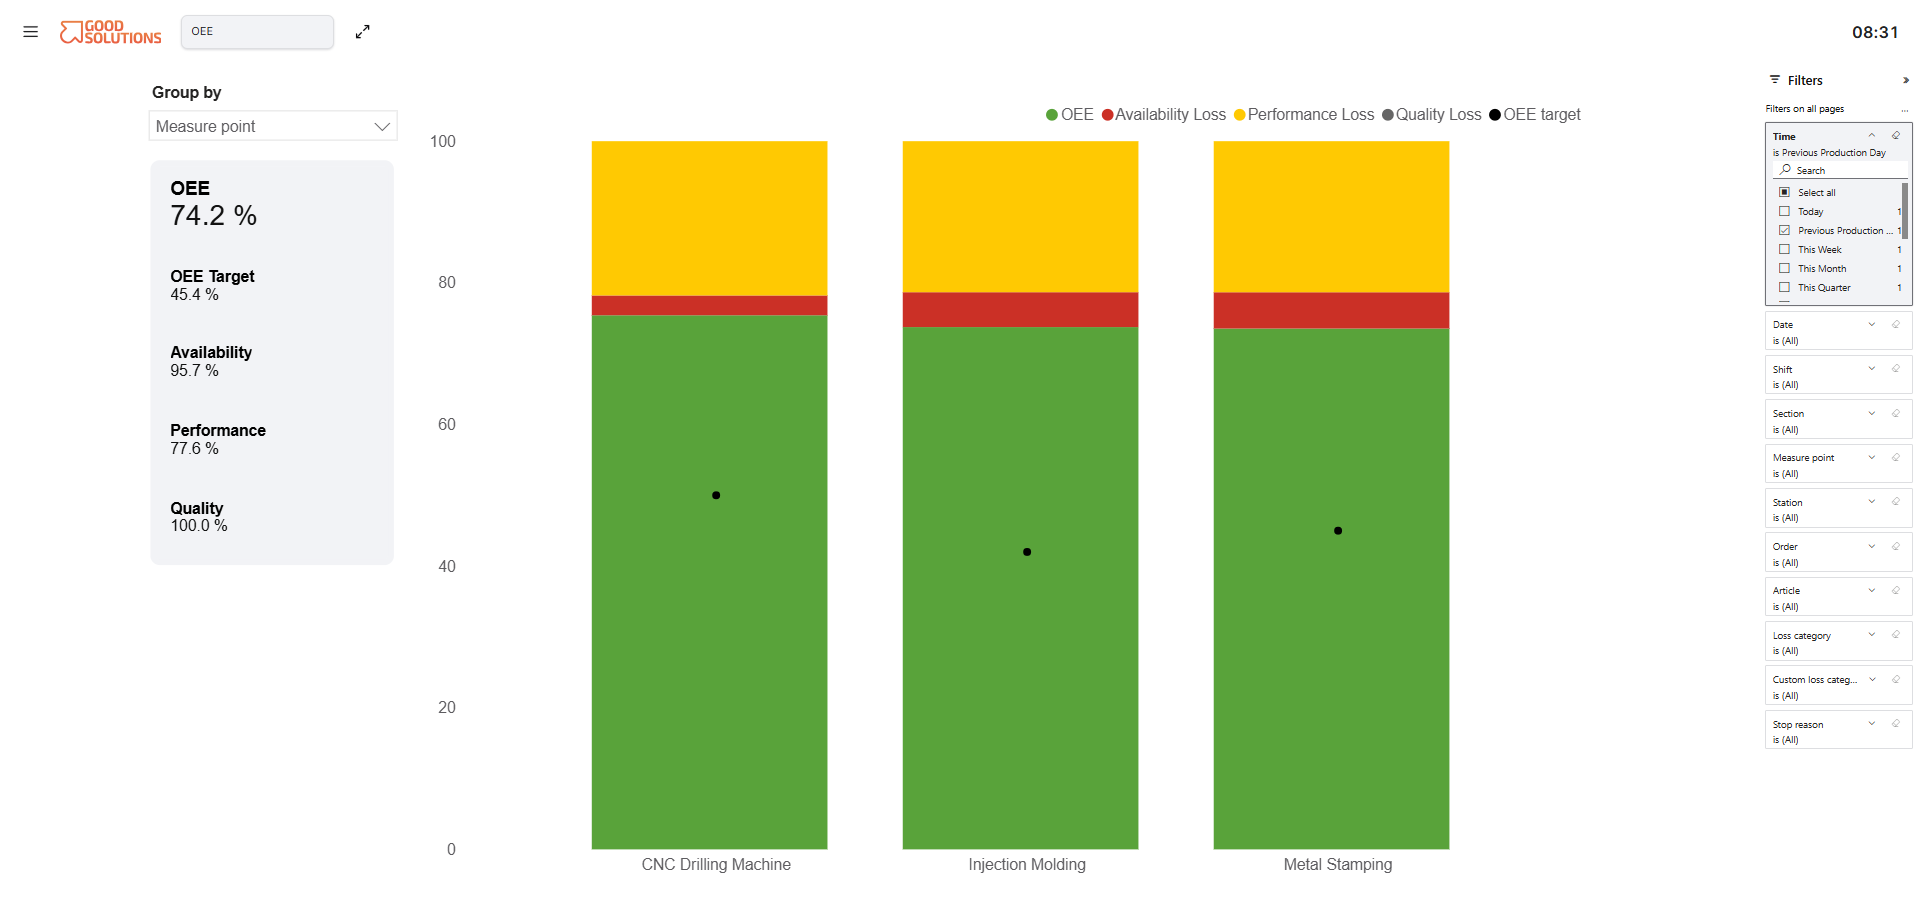
Understanding the OEE Report
The report consists of three main areas.
1. KPI Summary
On the left side, you will find a summary of important production metrics:
| KPI | Description |
|---|---|
| OEE | Overall production efficiency, expressed as a percentage. |
| OEE Target | The target OEE for the selected production data. |
| Availability | Percentage of planned production time spent producing. |
| Performance | Production speed compared with the expected speed. |
| Quality | Percentage of production that meets quality requirements. |
These metrics provide a quick overview of production performance for your current selection.
2. OEE Chart
The central chart visualizes OEE and production losses for different groups.
Each bar represents 100% of the production potential within the report's OEE calculation.
The colors indicate:
- Green – OEE: Effective production.
- Red – Availability Loss: Production time lost due to stops.
- Yellow – Performance Loss: Capacity lost through reduced production speed and other performance losses.
- Grey – Quality Loss: Production capacity lost through scrap and quality problems.
- Black dot – OEE Target: The target for each group.
This makes it easy to compare performance and identify which types of losses have the greatest impact.
Example: Two machines may have similar OEE values, but one may experience significant downtime while the other primarily suffers from reduced production speed. Understanding this difference helps determine which improvements to prioritize.
3. Filters
The filter panel on the right allows you to narrow the analysis to specific production data.
Available filters shown in the report include:
- Time and date.
- Shift.
- Section.
- Measure Point.
- Station.
- Order.
- Article.
- Stop Category.
- Stop Reason.
Use filters to focus on a particular production area, product, shift, or type of production loss.
Grouping Your OEE Data
The Group By selector above the KPI summary determines how the chart organizes production performance.
You can group the report by:
| Group By | What You Can Analyse |
|---|---|
| Measure Point | Compare OEE between machines or production lines. |
| Section | Compare performance between production areas. |
| Shift | Identify differences between shifts. |
| Article | Understand how OEE varies between products. |
| Hour | Identify performance differences throughout the day. |
| Date | Compare daily production performance. |
| Week | Follow weekly performance. |
| Month | Analyse longer-term trends. |
Example: If you suspect that production performance differs between shifts, select Shift under Group By. The chart will then show OEE and losses for each shift, making differences easier to identify.
How to Use the OEE Report
Follow these steps to analyse production performance.
Step 1: Select Your Time Period
Use the Time filter to choose the period you want to investigate.
For example, select the previous production day to review yesterday's performance or a longer period to identify recurring patterns.
Step 2: Apply Relevant Filters
Select the production areas, Measure Points, Articles, or other dimensions you want to include.
For example, filter on a specific Section to focus on its production performance.
Step 3: Choose How to Group the Data
Use Group By to determine how the results should be compared.
For example, select Measure Point to compare machines or Week to follow performance over time.
Step 4: Identify the Largest Losses
Review the colored bars to understand which losses contribute most to reduced OEE.
- Large red areas suggest Availability problems.
- Large yellow areas suggest Performance problems.
- Large grey areas suggest Quality problems.
Compare the green OEE bars with the black target markers to identify where performance differs from expectations.
Step 5: Investigate and Take Action
Use the results to identify which production areas require further investigation.
For example, if a machine has significant Availability losses, use the Timeline or relevant loss reports to investigate recurring stops and their causes.
Practical Examples
Example 1: Comparing Production Lines
Group by Measure Point to compare three production lines.
One line has significantly lower OEE than the others, primarily because of Availability losses.
The Production Manager can investigate its downtime to identify the main causes.
Example 2: Understanding Shift Differences
Group by Shift and select the previous week.
If one shift consistently has lower OEE, investigate whether the difference relates to machine stops, production speed, Article mix, or other operating conditions.
Example 3: Finding Products with High Performance Losses
Group by Article to compare production efficiency between products.
An Article with significant Performance losses may require further investigation into cycle times, machine settings, or production methods.
Example 4: Following Improvement Results
Group by Week and select a period covering several weeks.
Compare OEE and loss distribution before and after an improvement activity to evaluate whether production performance has improved.
Tips for Getting More Value from the Report
- Start with the largest losses: Focus on the production problems with the greatest potential impact.
- Compare similar conditions: Differences in Article mix, scheduling, and production requirements can affect OEE comparisons.
- Look beyond the OEE percentage: Two machines with the same OEE may require completely different improvements.
- Use longer time periods: Recurring patterns are often easier to identify across several weeks.
- Follow up regularly: Include OEE and loss analysis in daily and weekly production meetings.