
The Shift Report gives operators a quick overview of production performance during a selected shift.
It combines production quantities, time, OEE metrics, production speed, and stop information to help you understand how the shift is performing.
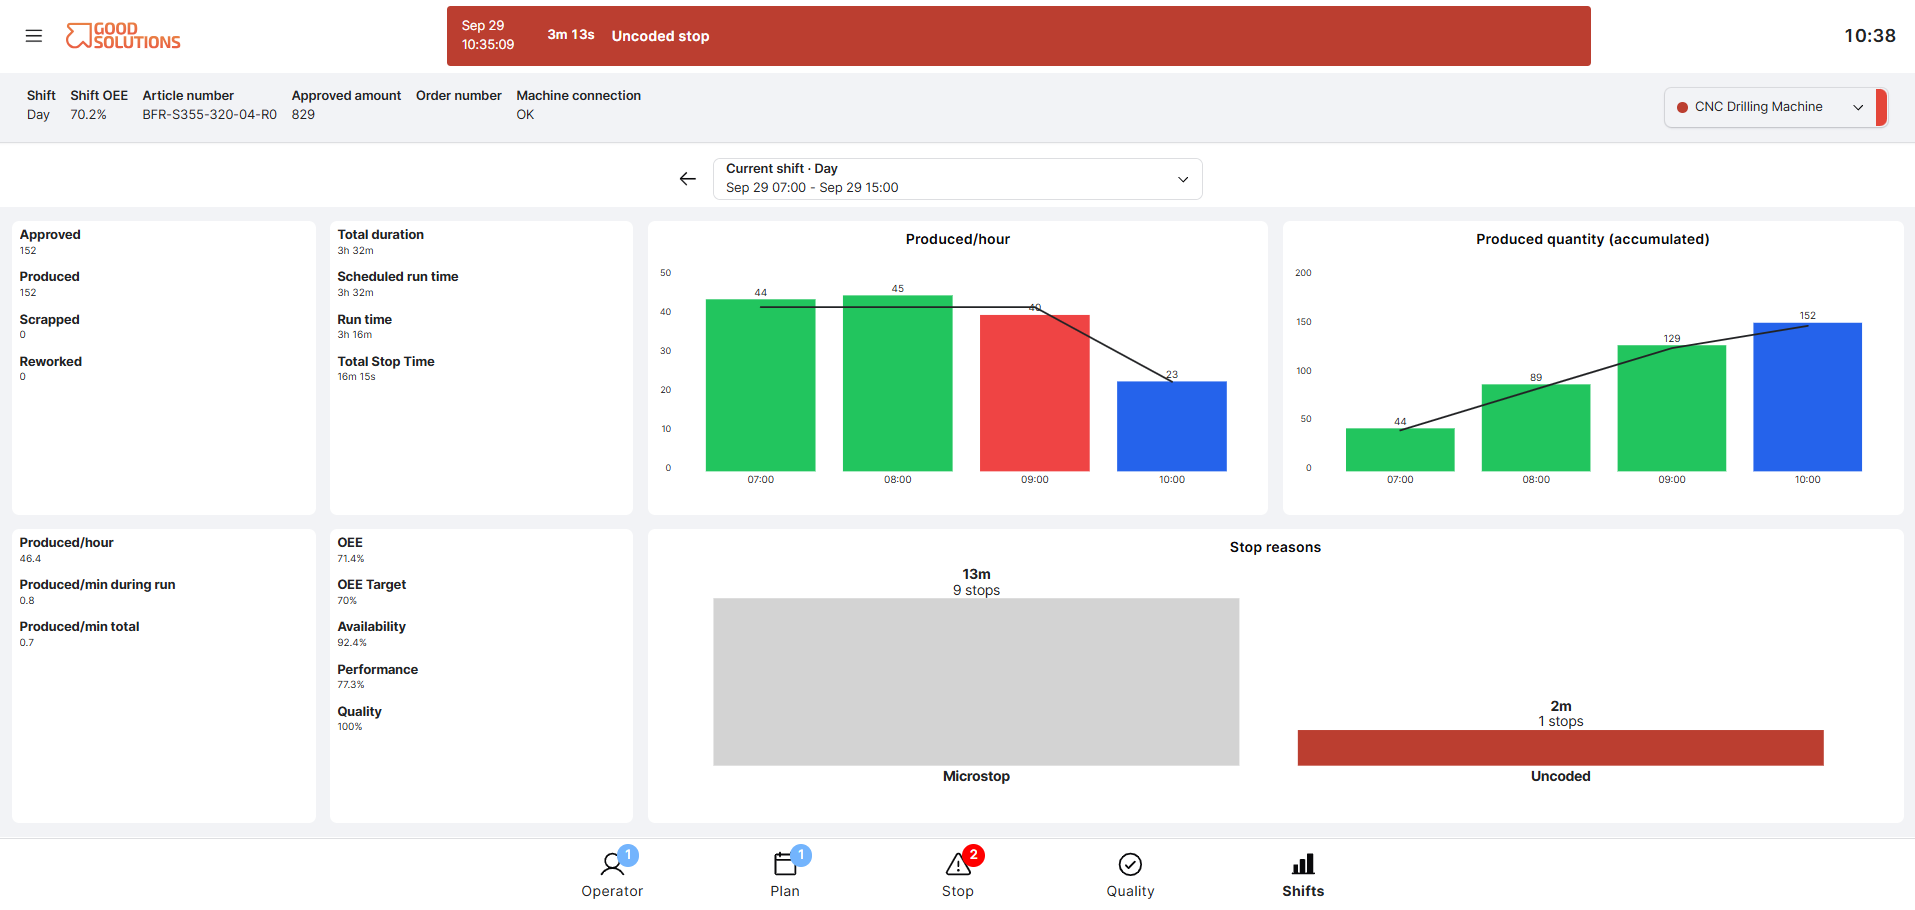
The production quantity metrics show what has been produced during the shift.
- Produced – Total number of items produced.
- Approved – Number of produced items counted as approved production.
- Scrapped – Number of items registered as scrap.
- Reworked – Number of items registered as requiring rework.
These metrics provide a quick overview of both production output and quality losses.
Production timeThe time metrics explain how the available production time has been used.
- Total duration – Total elapsed time covered by the Shift Report.
- Scheduled run time – Time during which production was scheduled to run.
- Run time – Time during which the Measure Point was actually producing.
- Total Stop Time – Total time lost to production stops during scheduled production.
Together, these metrics help you understand how much of the scheduled production time has actually been used for production.
Production speedThe Shift Report includes several metrics for understanding production speed.
- Produced/hour – Average number of items produced per hour.
- Produced/min during run – Average number of items produced per minute while the Measure Point was actually running.
- Produced/min total – Average number of items produced per minute across the full period, including production stops.
Produced/hour chart
The Produced/hour chart shows how production output has developed during the shift.
Each bar represents the production output for a period, making it easier to see when production was running faster or slower.
Produced quantity (accumulated)
The Produced quantity (accumulated) chart shows how total production builds up throughout the shift.
This makes it easier to see whether production is developing as expected and how much has been produced at different points during the shift.
OEEOEE (Overall Equipment Effectiveness) provides an overall measure of production effectiveness based on three components: Availability, Performance, and Quality.
Availability
Availability shows how much of the scheduled production time was actually available for production.
Production stops reduce Availability. A large amount of stop time will therefore result in lower Availability.
Performance
Performance shows how effectively the Measure Point produced while it was running compared with its expected or optimal production speed.
Running below the expected production speed reduces Performance.
Quality
Quality represents the proportion of production that meets the required quality outcome.
Quality losses such as scrap reduce the Quality result.
OEE Target
OEE Target shows the target OEE configured for the Measure Point. Comparing the current OEE with the target helps you quickly understand how the shift is performing in relation to its expected level.
Stop reasonsThe Stop reasons section shows where production time has been lost during the shift.
For each Stop Reason, you can see information such as:
- Total stop time
- Number of stops
- Stop Reason
This helps operators quickly identify which types of stops have had the greatest impact on the shift.
Uncoded represents production stops that have not yet been assigned a Stop Reason. Coding these stops helps improve the accuracy of production analysis.
Microstops are short production stops that are tracked separately according to the configuration of the Measure Point.
Using the Shift ReportThe Shift Report can help you answer questions such as:
- How much have we produced this shift?
- Are we meeting our expected production rate?
- How much production time have we lost?
- What are the main reasons for production stops?
- How are we performing against our OEE target?
- Are there uncoded stops that need attention?
- How much scrap or rework has been recorded?
By reviewing these metrics together, you can understand both what was produced and where production losses occurred during the shift.