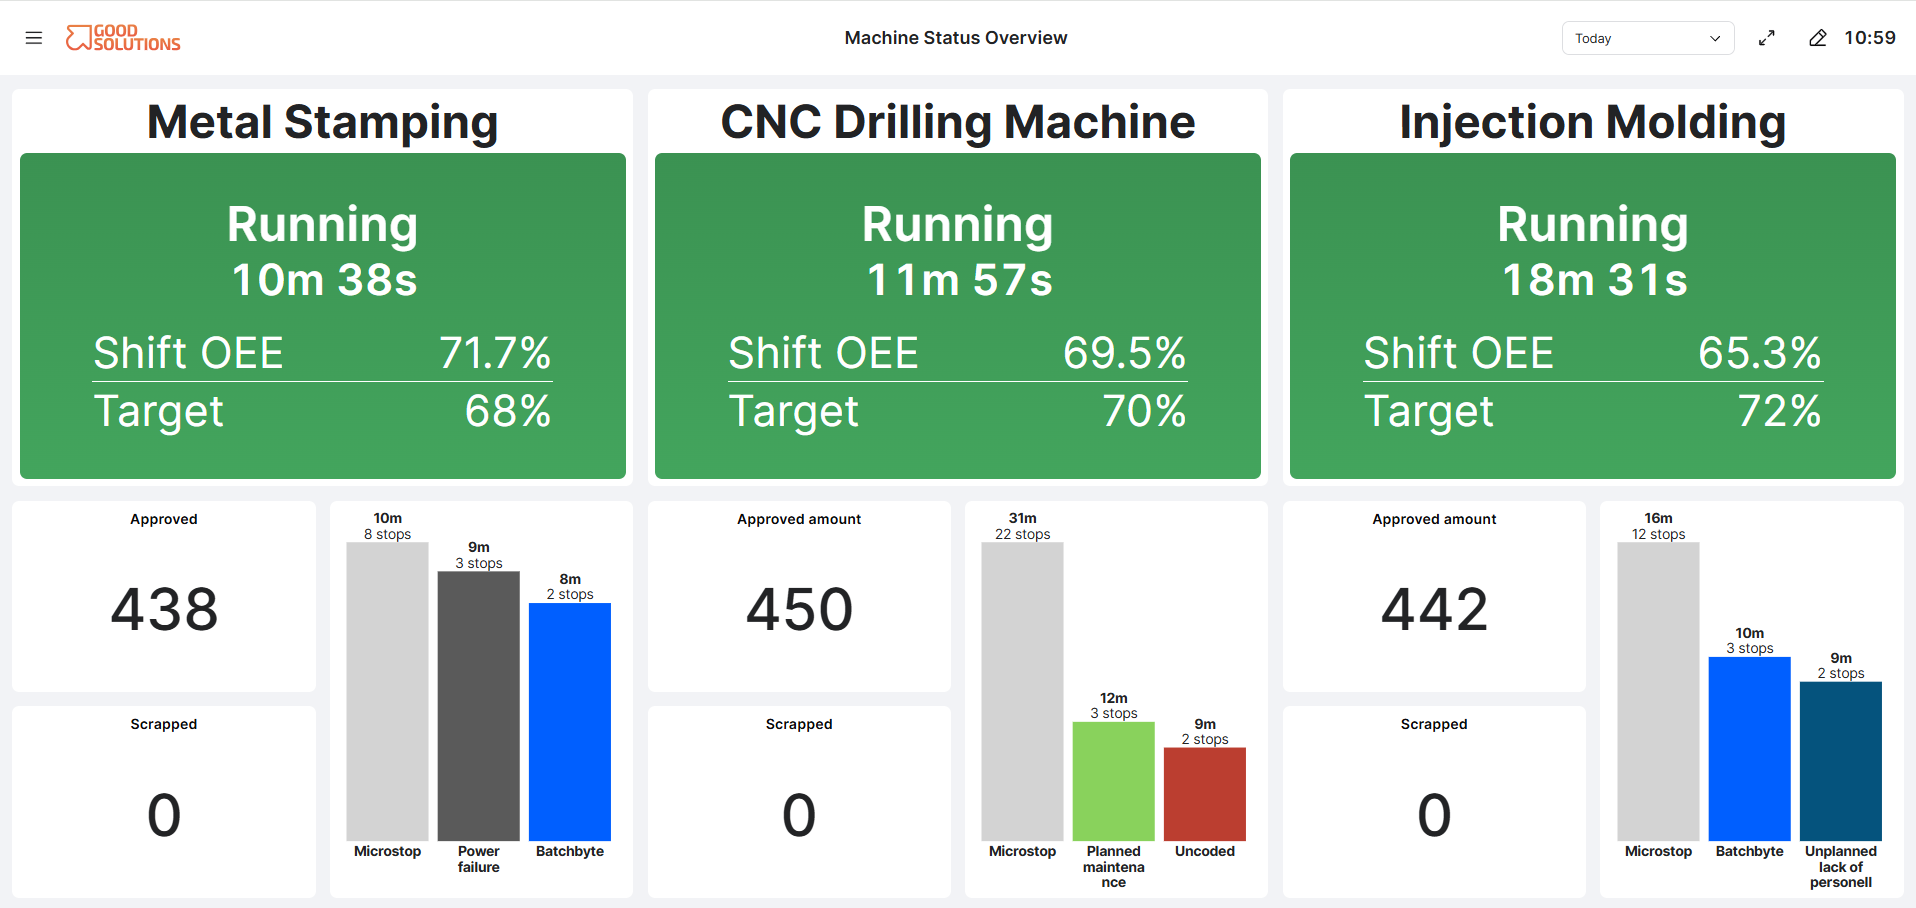
Dashboards in Good Solutions provide a flexible way to visualise production data and monitor the information that matters most to your team.
A Dashboard is built using different Visualisations, allowing you to combine production KPIs, charts, tables, status information, and other production data into a single view.
What is a Dashboard?
A Dashboard is a configurable page that brings together production information from one or more Measure Points.
Dashboards can be created for different purposes. For example, you might create a Dashboard for:
- Monitoring current production performance
- Following OEE and other production KPIs
- Understanding production losses and Stop Reasons
- Reviewing production output and quality
- Supporting daily production meetings
- Comparing performance between Measure Points
- Displaying production information on a TV or shared screen
This means different teams can create Dashboards that match the way they work and the information they need.
What are Visualisations?
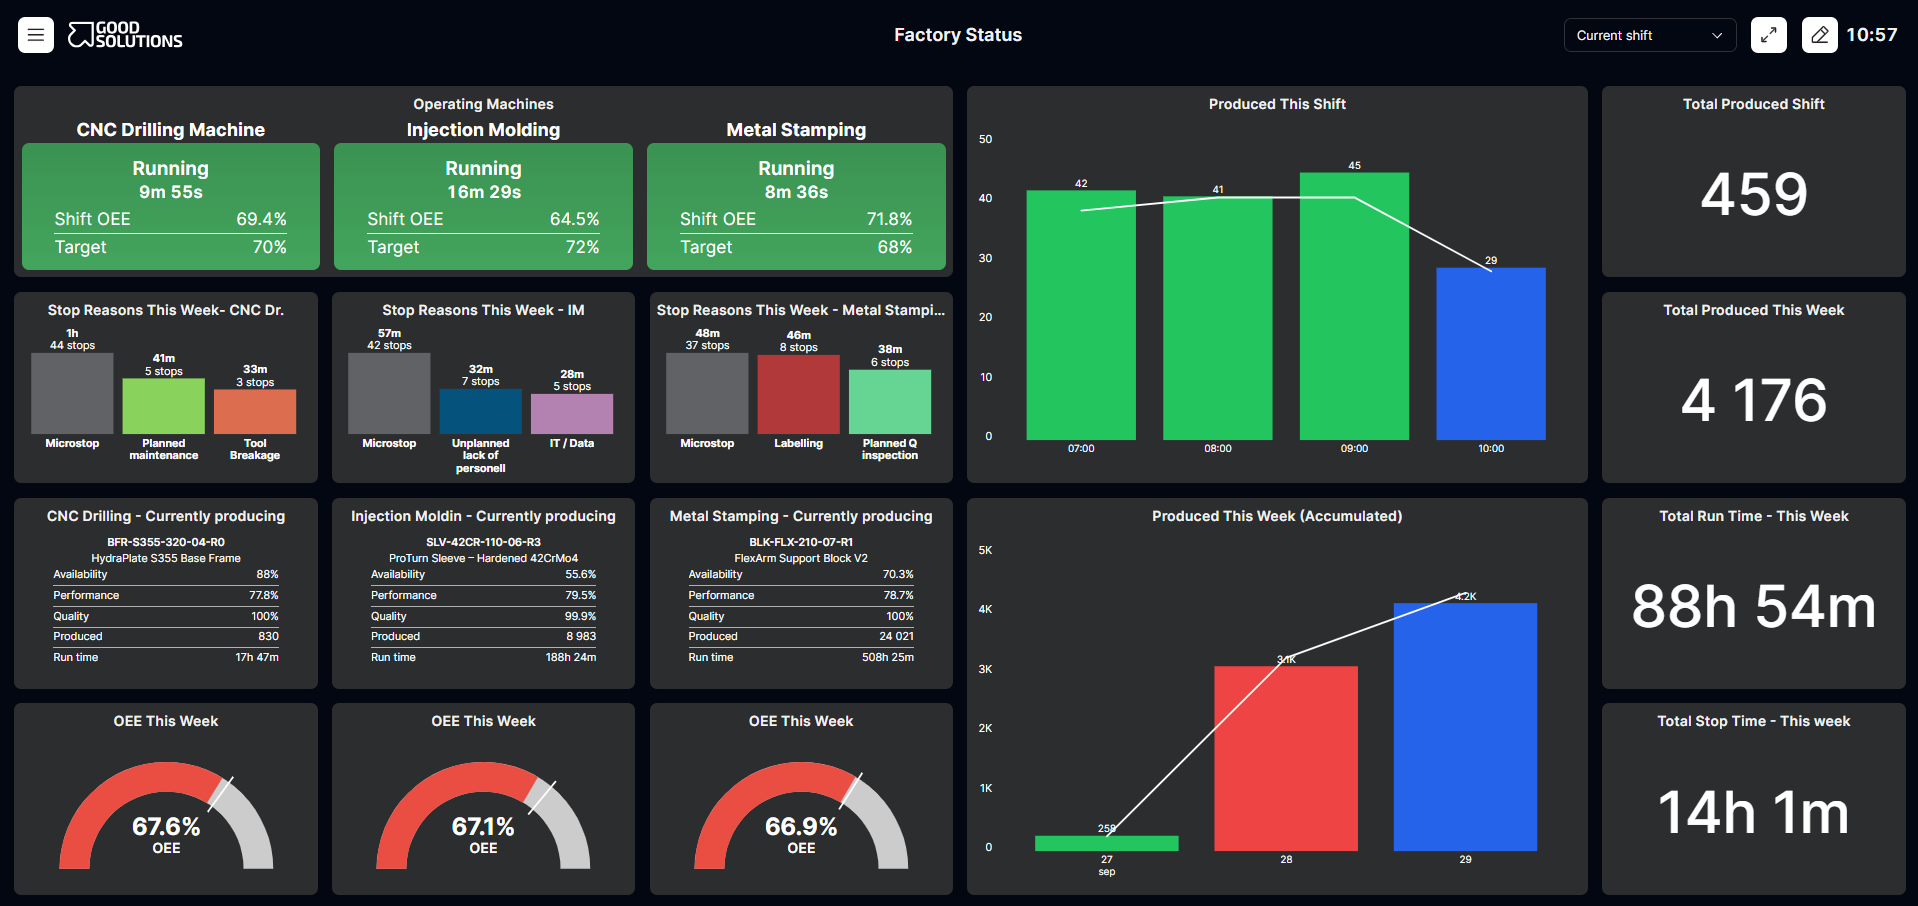
Visualisations are the individual components that make up a Dashboard.
Each Visualisation presents production information in a particular way. Depending on the type of Visualisation, this could be a KPI, chart, table, timeline, or other graphical representation.
Examples include:
- OEE and OEE Target
- Production quantities
- Machine status
- Stop Reasons
- Scrap Reasons
- Production Timeline
- Metrics tables
- OEE Speedometer
- Article and Order status
By combining different Visualisations, you can build a Dashboard that provides the right level of information for its intended audience.
Dashboard filters
Dashboards can use filters to control which production data is displayed.
For example, you may want to view information for a particular time period or production context. When filters are changed, the Visualisations on the Dashboard update to reflect the selected data.
This makes it possible to use the same Dashboard to investigate production performance across different periods.
Dashboards for different purposes
Not every Dashboard needs to contain the same information.
A Dashboard displayed on a production floor might focus on current production status, OEE, targets, and production losses, while a Dashboard used during a production meeting might provide more detailed information about stops, quality, trends, and performance.
The goal is to bring the most relevant production information together in one place.
Viewing and editing Dashboards
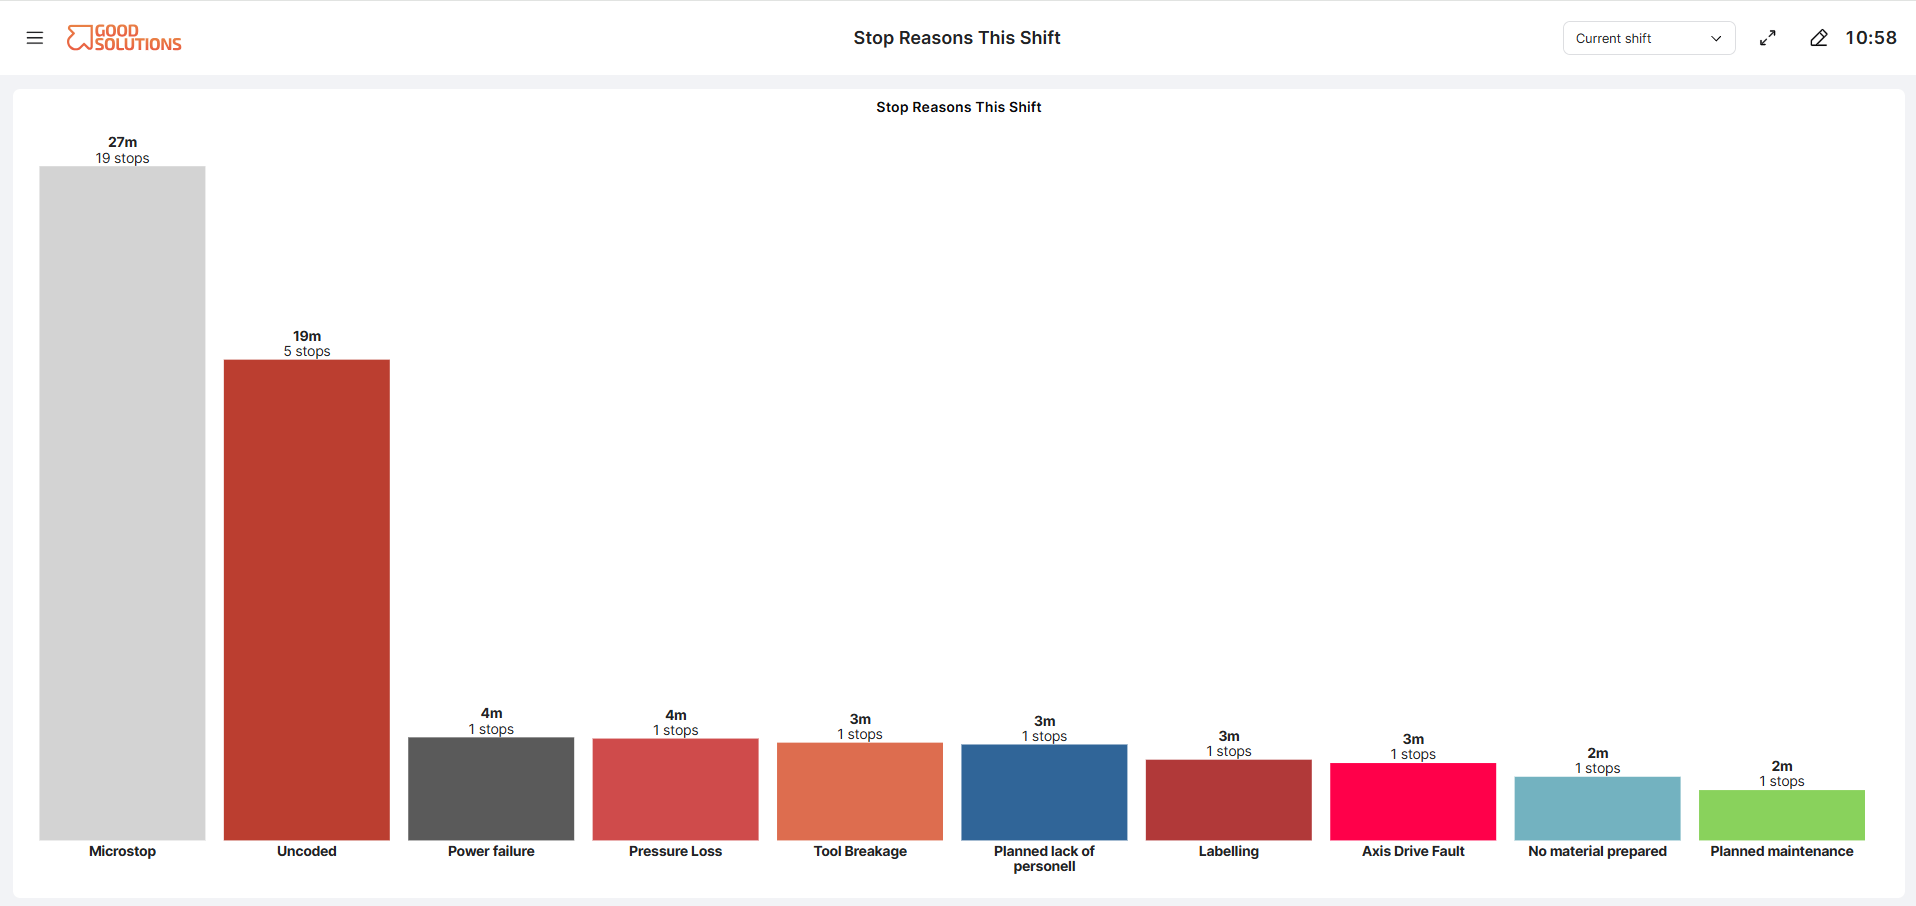
Dashboards have different ways of working depending on what you want to do.
When viewing a Dashboard, you can use it to follow and analyse production information without changing its configuration.
When editing a Dashboard, authorised users can configure the Dashboard and its Visualisations to determine what information should be displayed.
Why use Dashboards?
Dashboards help turn production data into information that is easier to understand and act on.
They can help your team:
- Follow production performance at a glance
- Identify production losses and problems
- Track important KPIs
- Compare actual performance with targets
- Support production meetings and improvement work
- Share a common view of production performance
By selecting the right Visualisations for each use case, Dashboards can provide anything from a simple production overview to a more detailed analysis of production performance.